Bill Rankin, 2009
download:
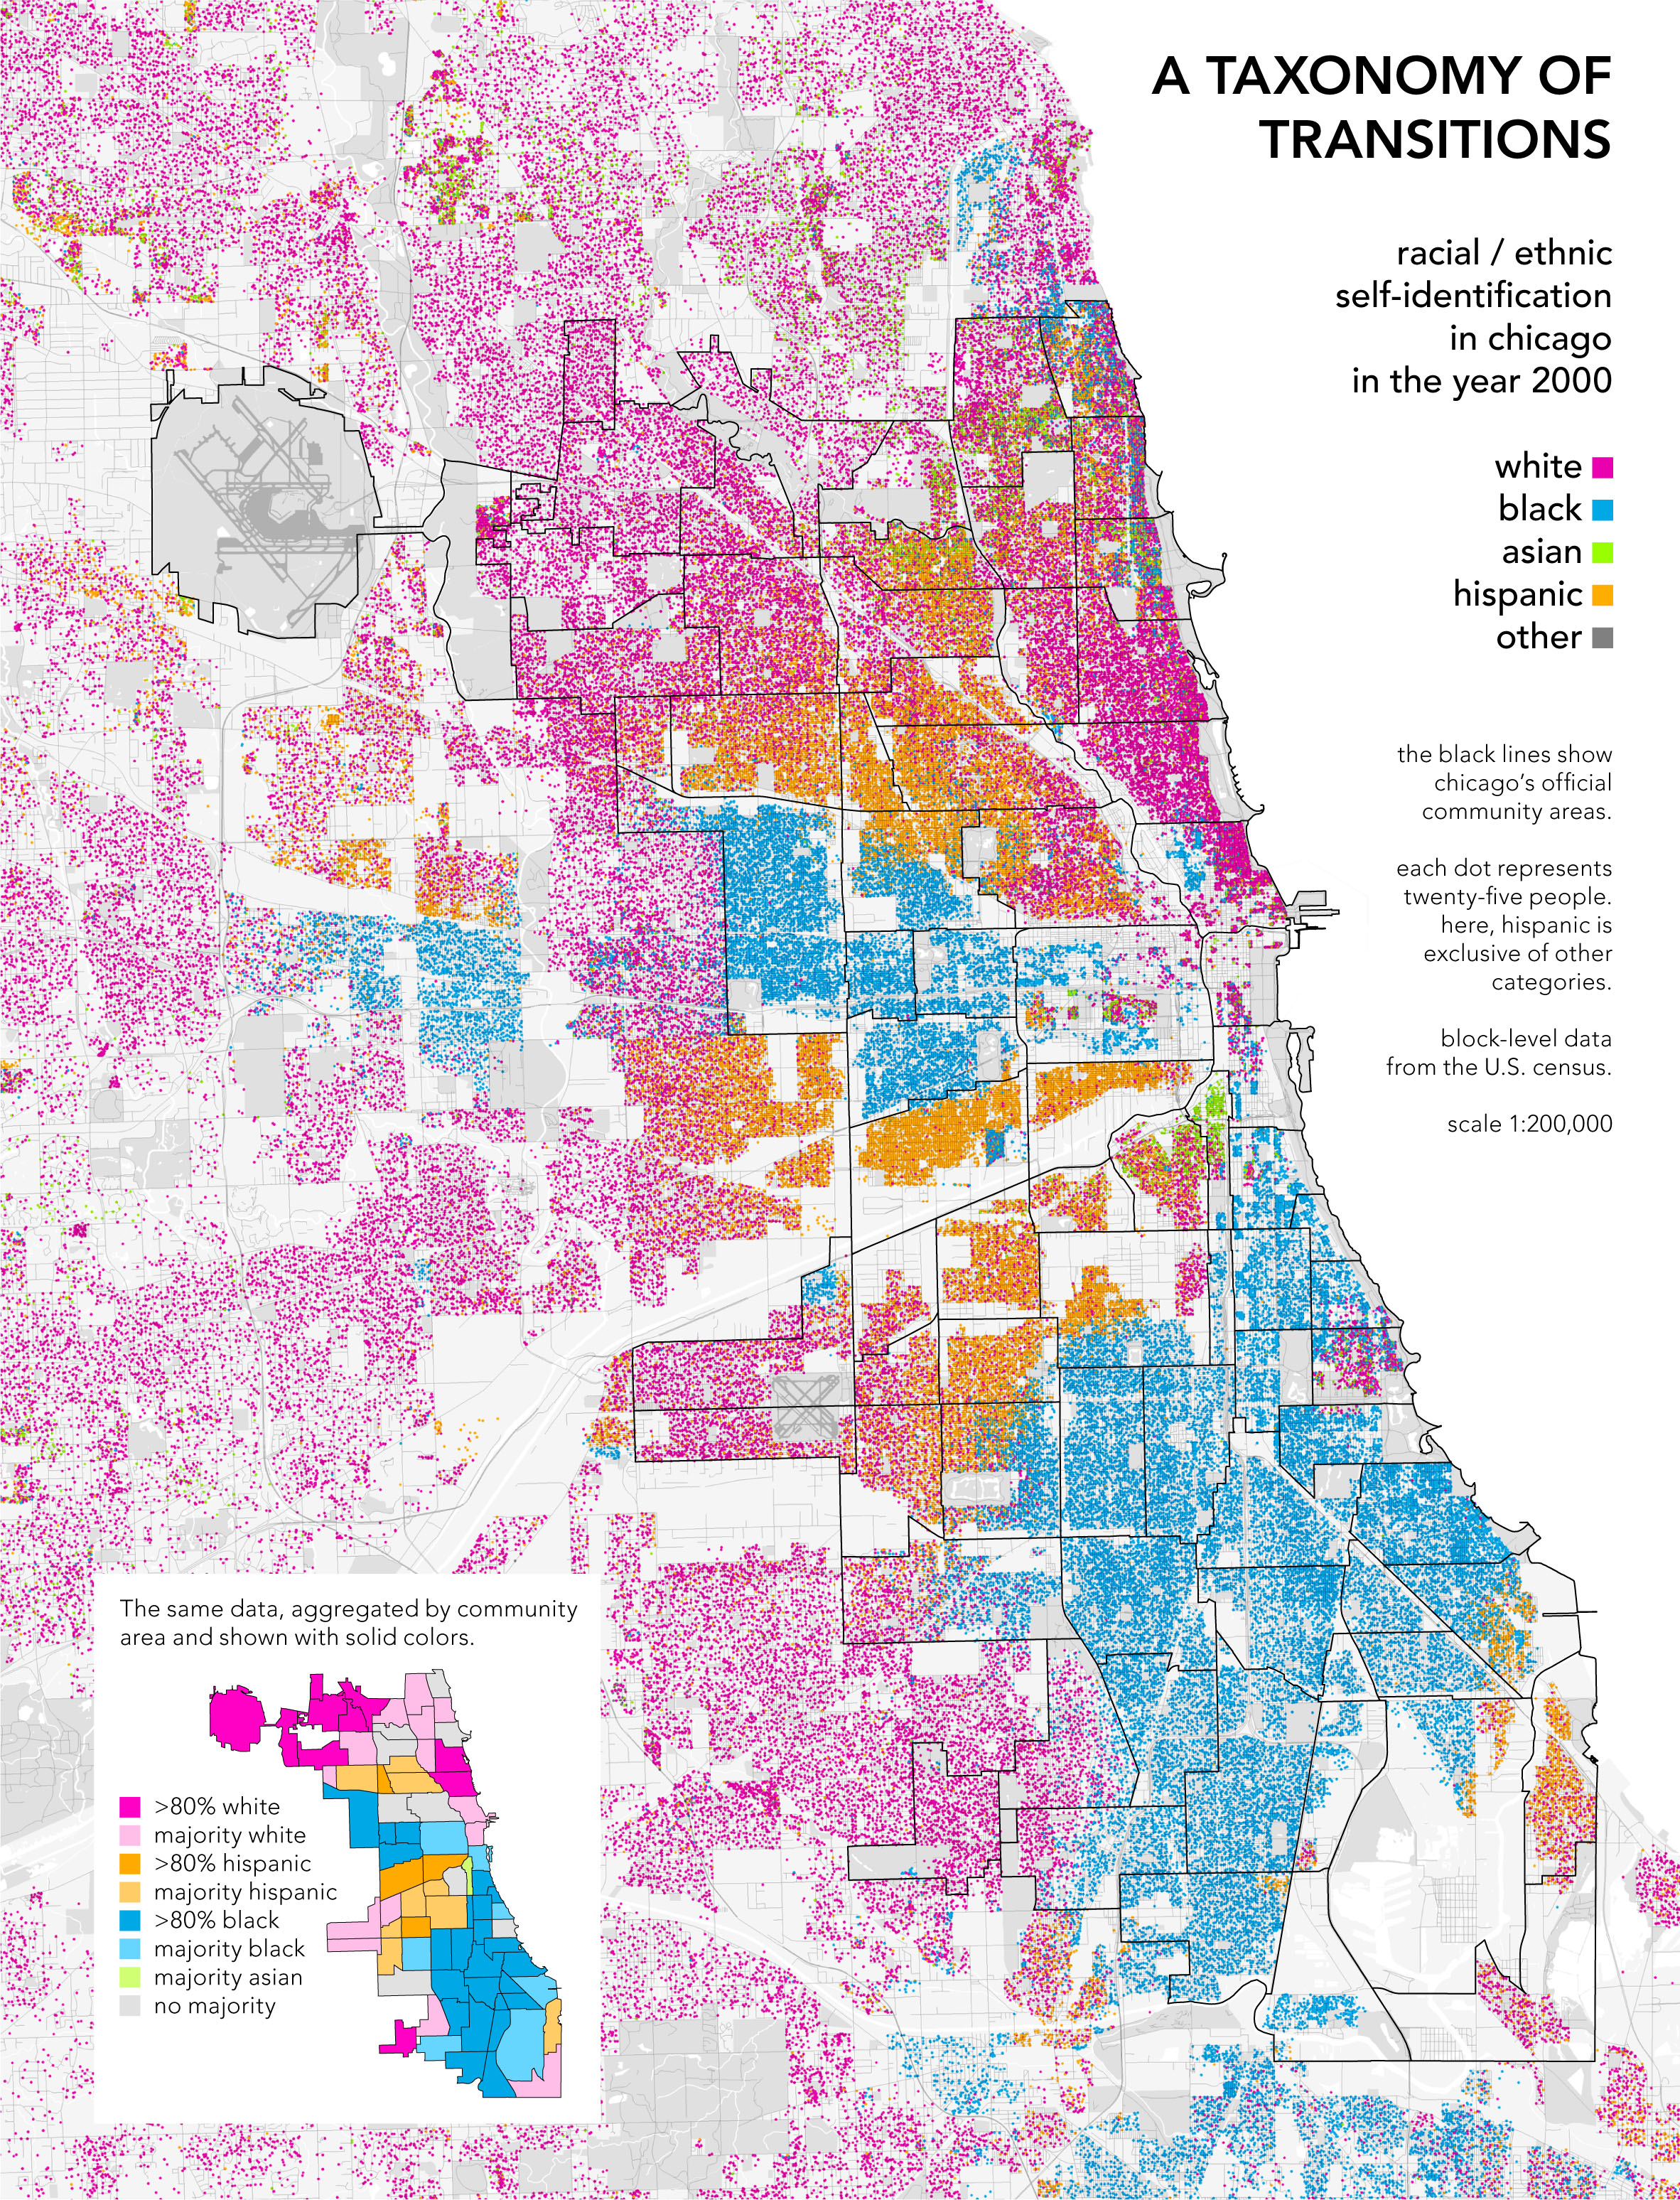
Race (2400x3000, 3.0 MB)
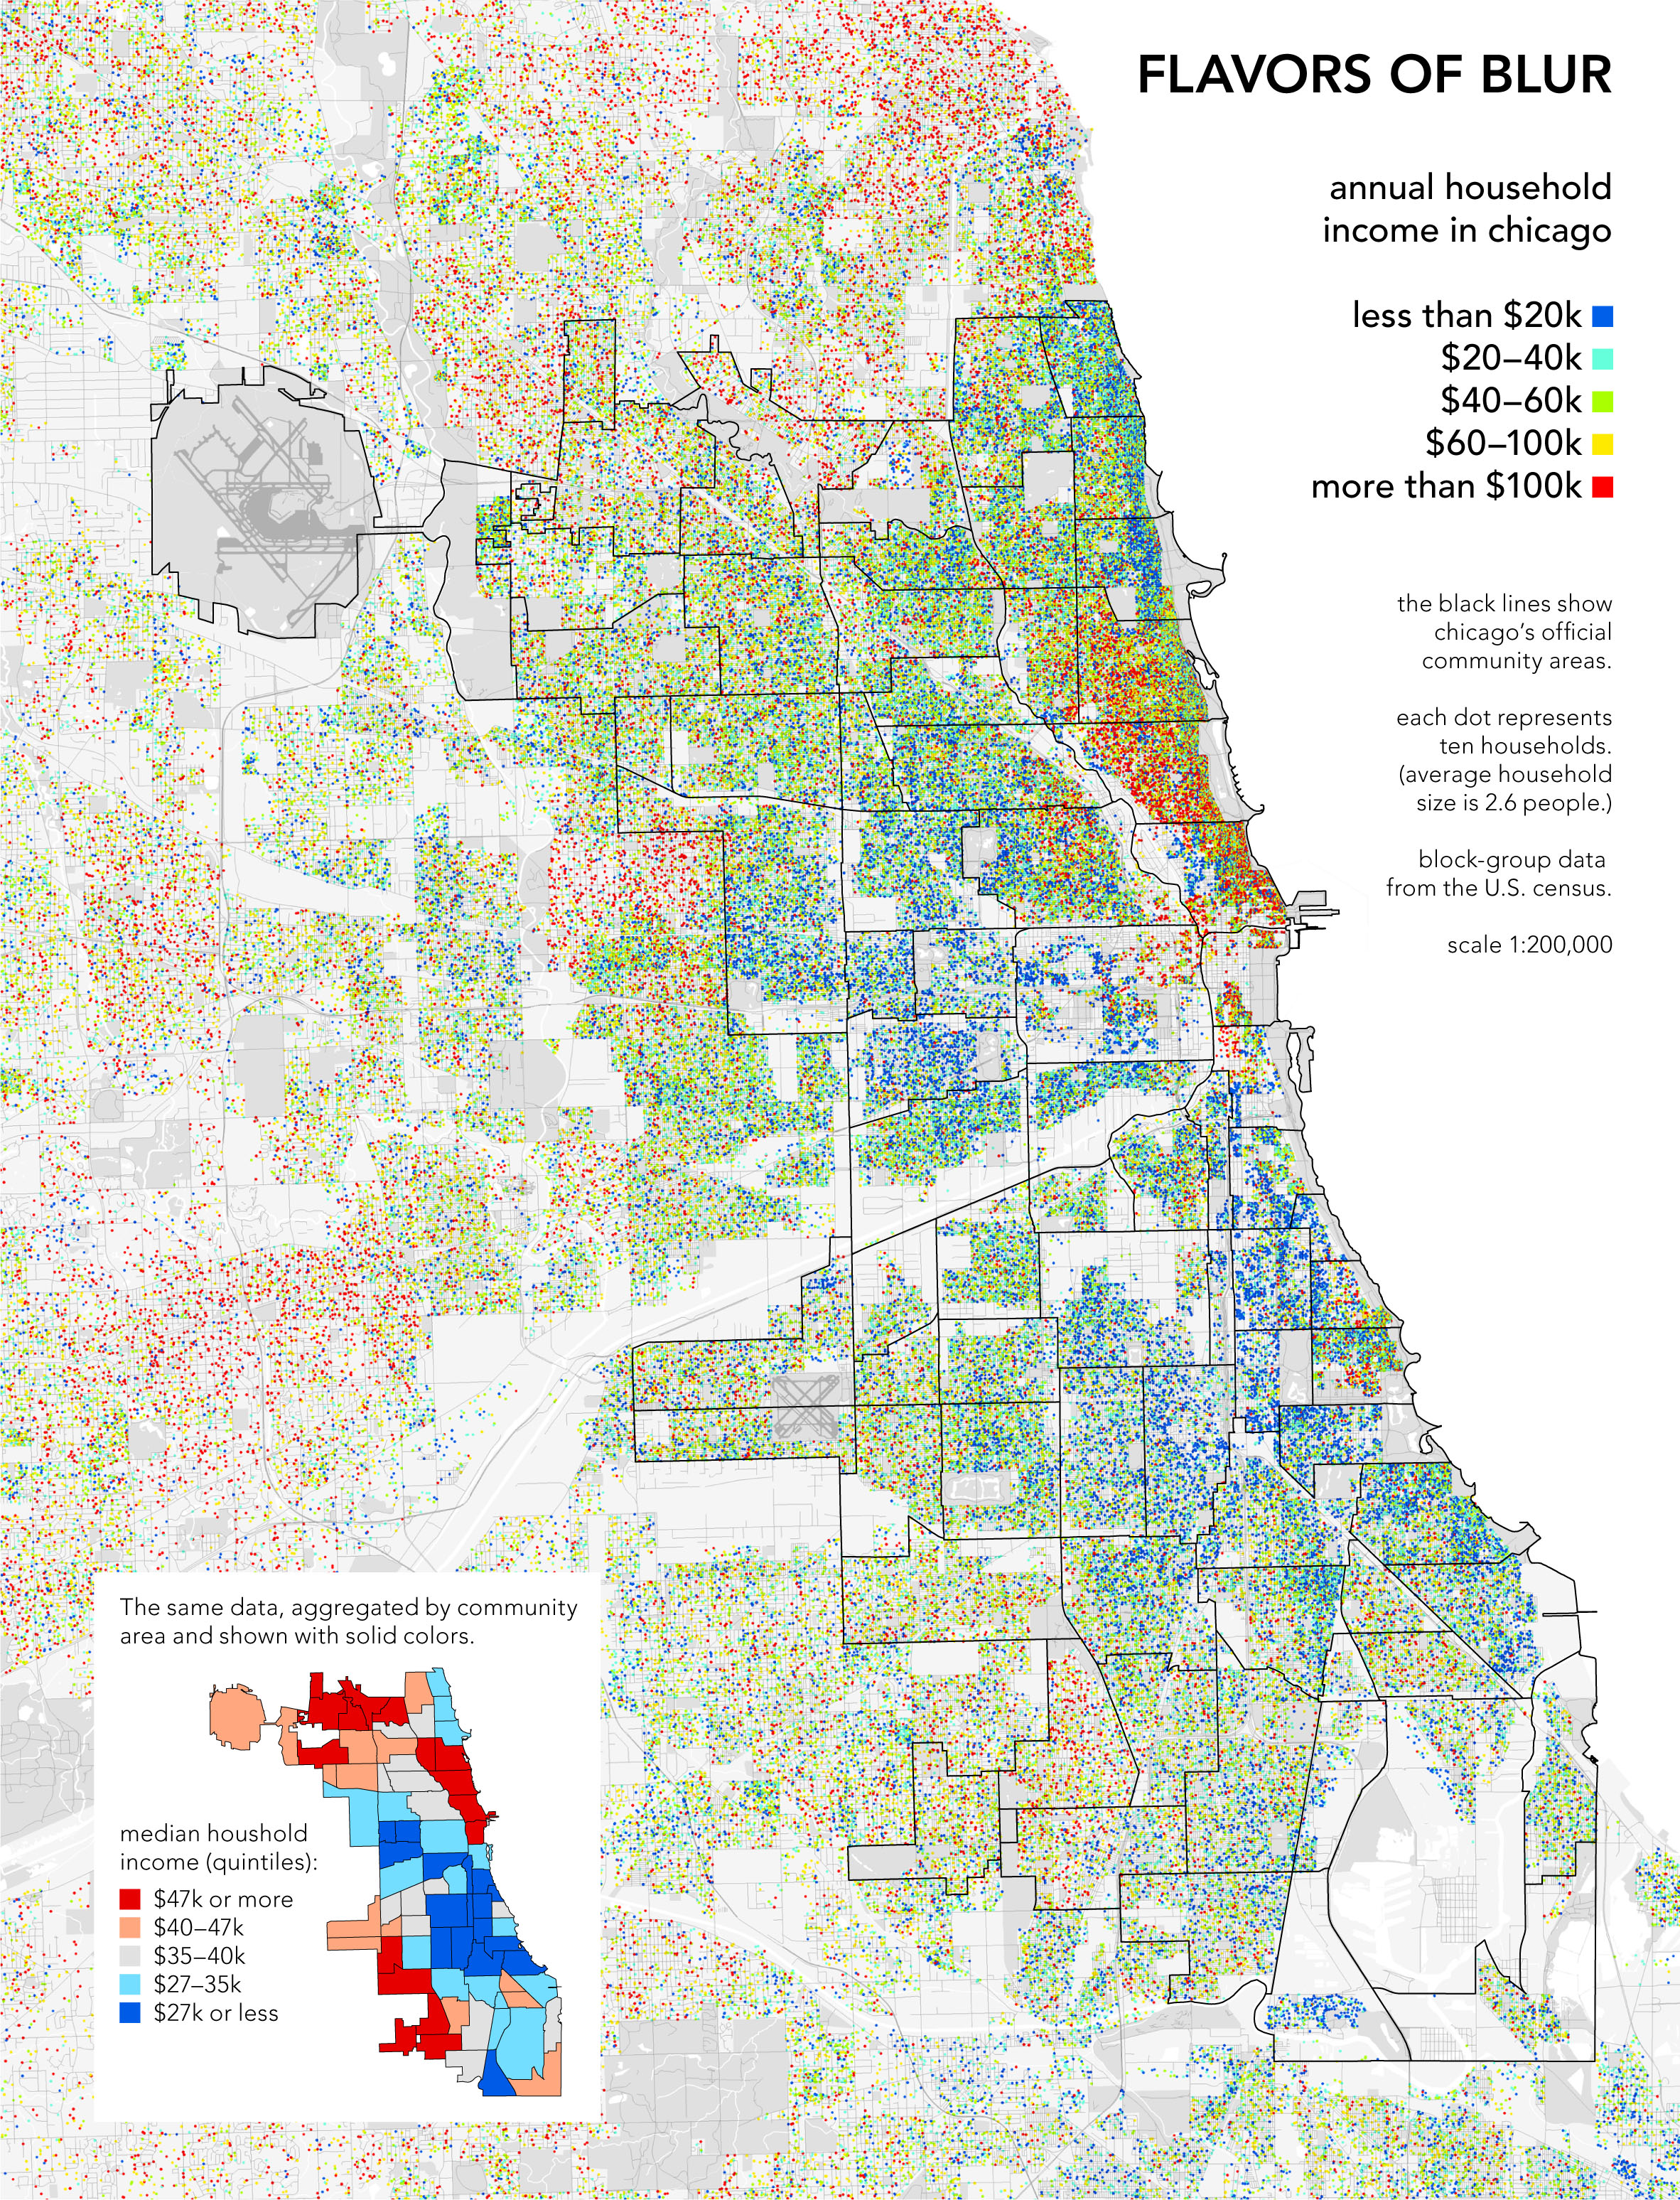
Income (2400x3000, 3.0 MB)
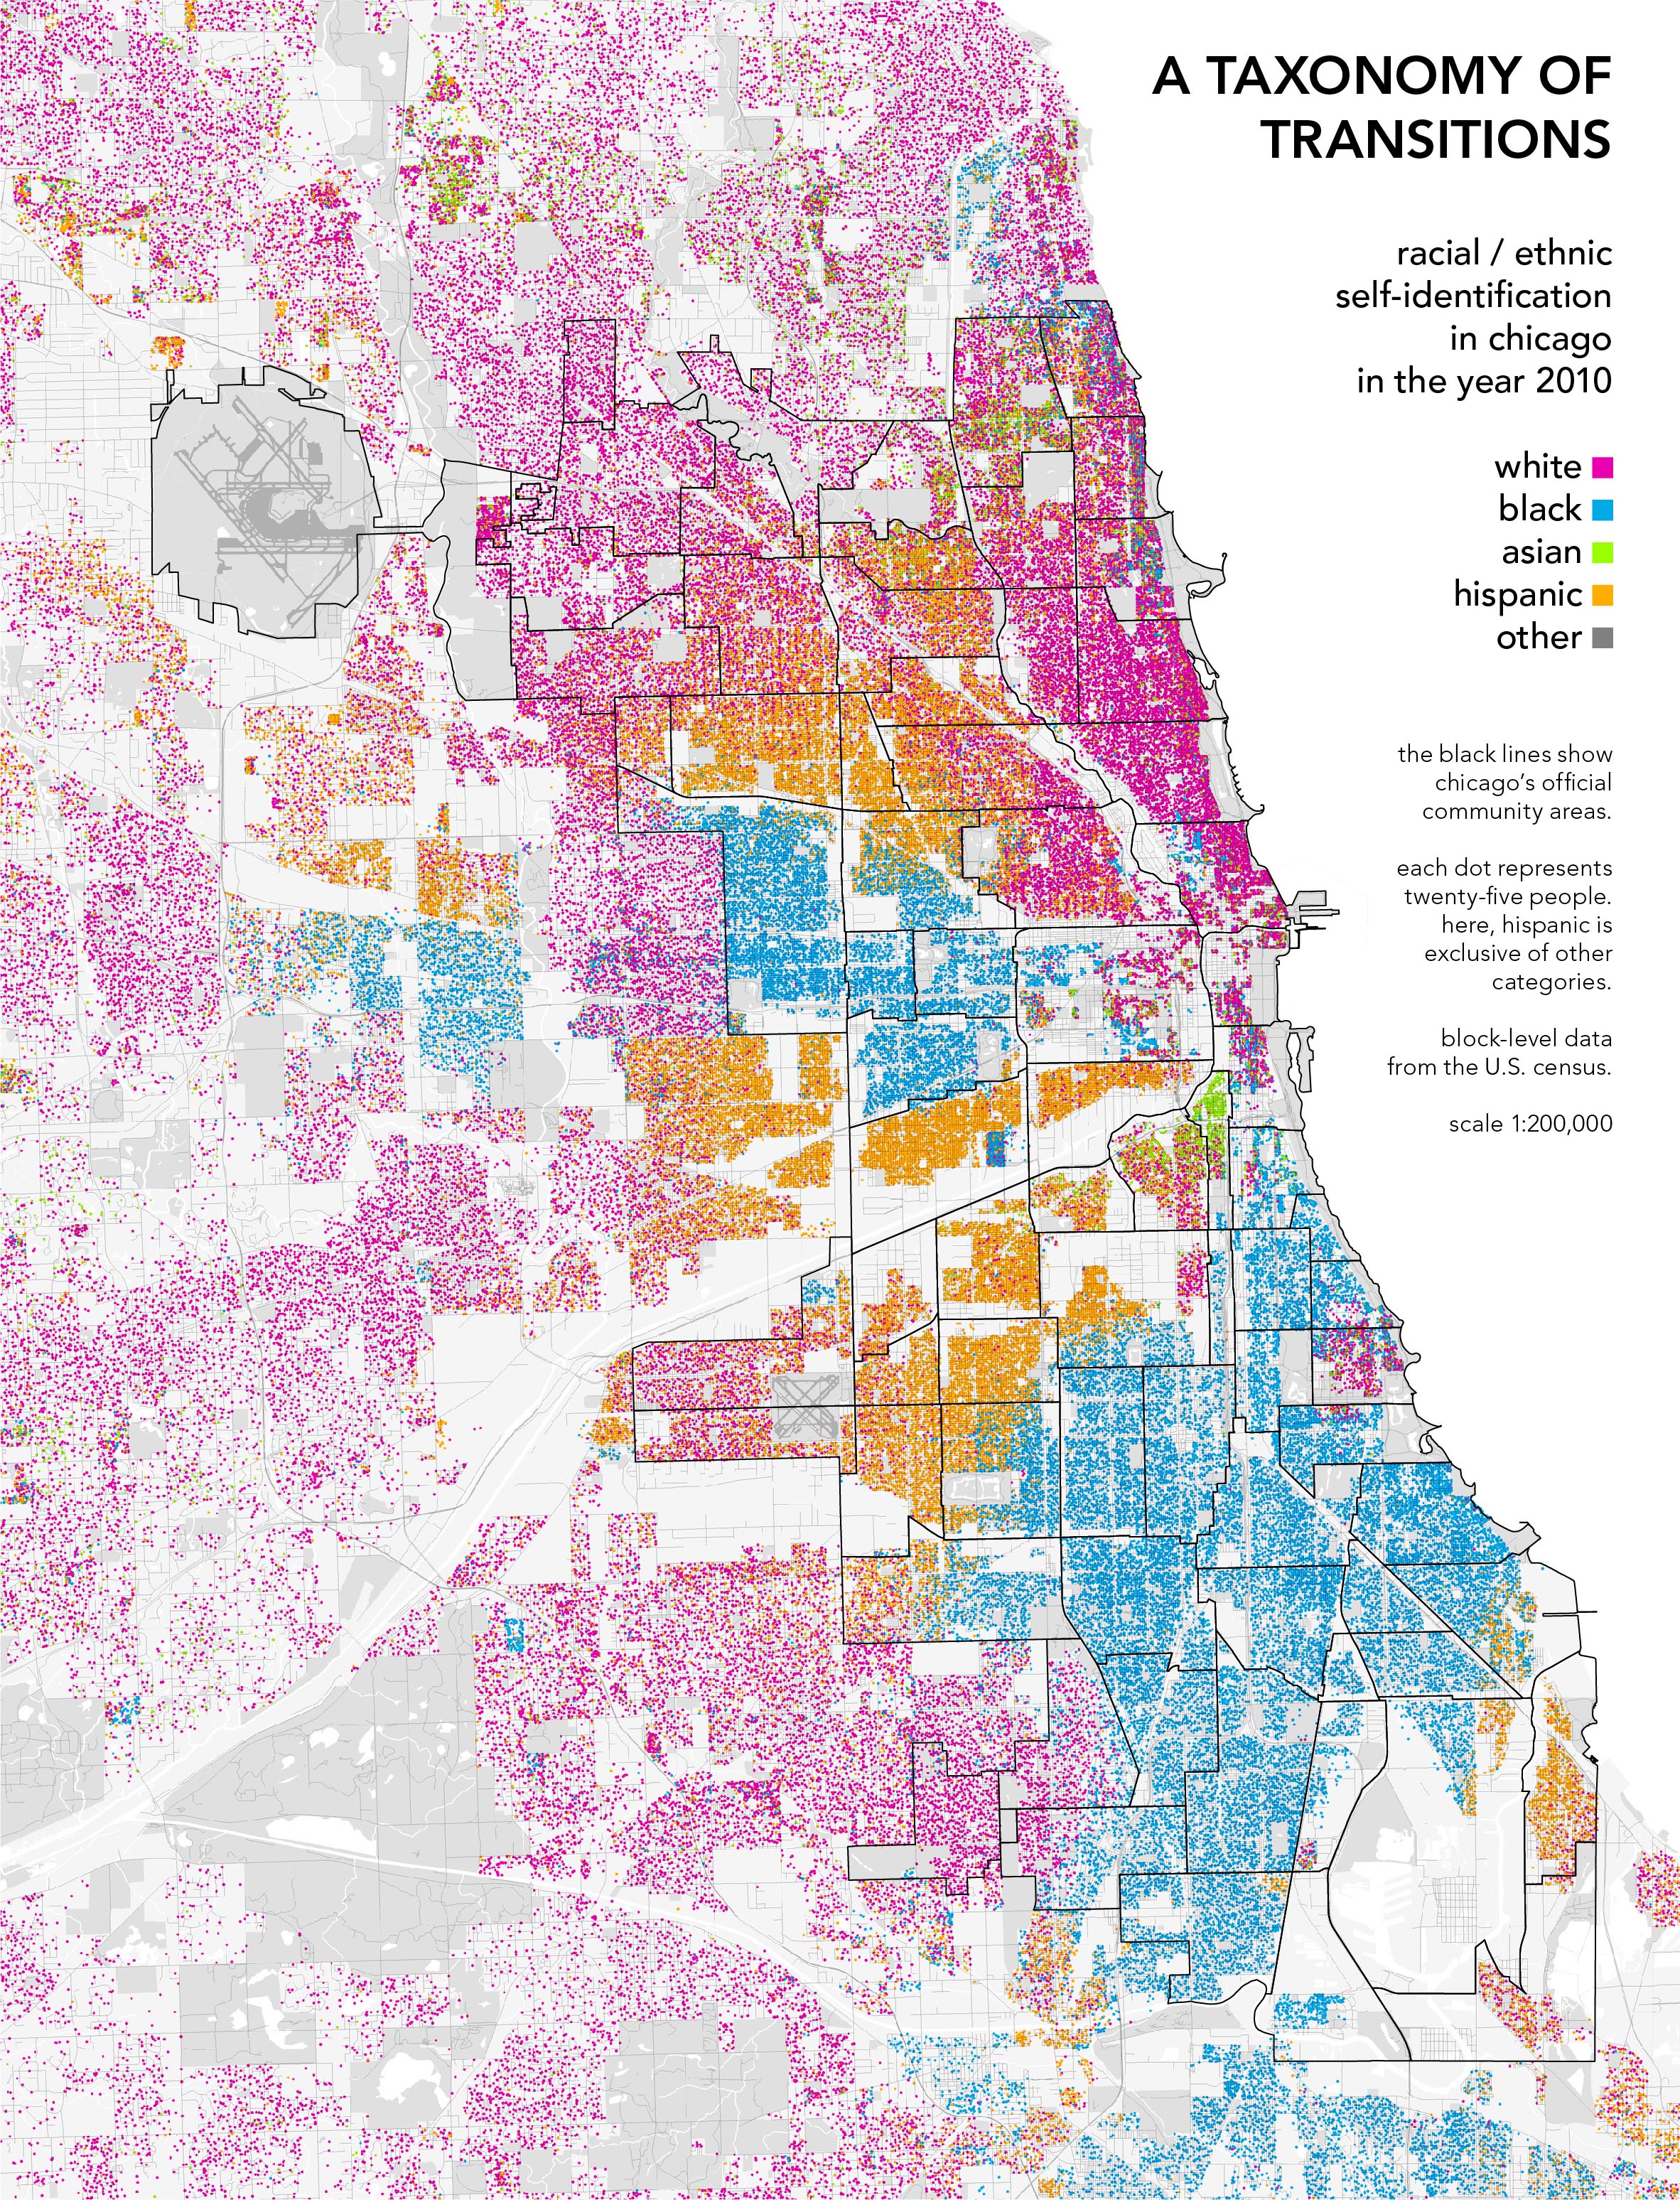
Race 2010 (2400x3000, 3.0 MB)
Any city-dweller knows that most neighborhoods don't have stark boundaries. Yet on maps, neighborhoods are almost always drawn as perfectly bounded areas, miniature territorial states of ethnicity or class. This is especially true for Chicago, where the delimitation of Chicago's official “community areas” in the 1920s was one of the hallmarks of the famous Chicago School of urban sociology. And maps showing perfectly homogeneous neighborhoods are still published today, in both popular and academic contexts alike.
My alternative is to use dot mapping to show three kinds of urban transitions. First, there are indeed areas where changes take place at very precise boundaries — such as between Lawndale and the Little Village, or Austin and Oak Park — and Chicago has more of these stark borders than most cities in the world. But transitions also take place through gradients and gaps as well, especially in the northwest and southeast. Using graphic conventions which allow these other possibilities to appear takes much more data, and requires more nuance in the way we talk about urban geography, but a cartography without boundaries can also make simplistic policy or urban design more difficult — in a good way.
This project was originally published as an essay in the Spring 2010 issue of Perspecta, the journal of the Yale School of Architecture.
In 2011 it won the MiniMax mapping contest at the "Moving Maps" cartographic bienalle in Lausanne, Switzerland.
