relation to zoning
Bill Rankin, 2006
In response to my original map of "underdevelopment" in Manhattan, urban planner Josh Jackson emailed me from New York with some ideas for a map which would show development in relation to FAR. This is my attempt at such a map. Thanks to Josh for helping me with these ideas; our email exchange is below.
From: Joshua Jackson
To: Bill Rankin
Date: March 8, 2006
Subject: NYC underdevelopment map
...I also produce a lot of GIS maps to identify underdeveloped / overdeveloped areas. One method I’ve used quite effectively (and I think perhaps might be of use to you) is to analyze how close buildings come to using the maximum floor area ratio (FAR) permitted under New York City zoning law.
...
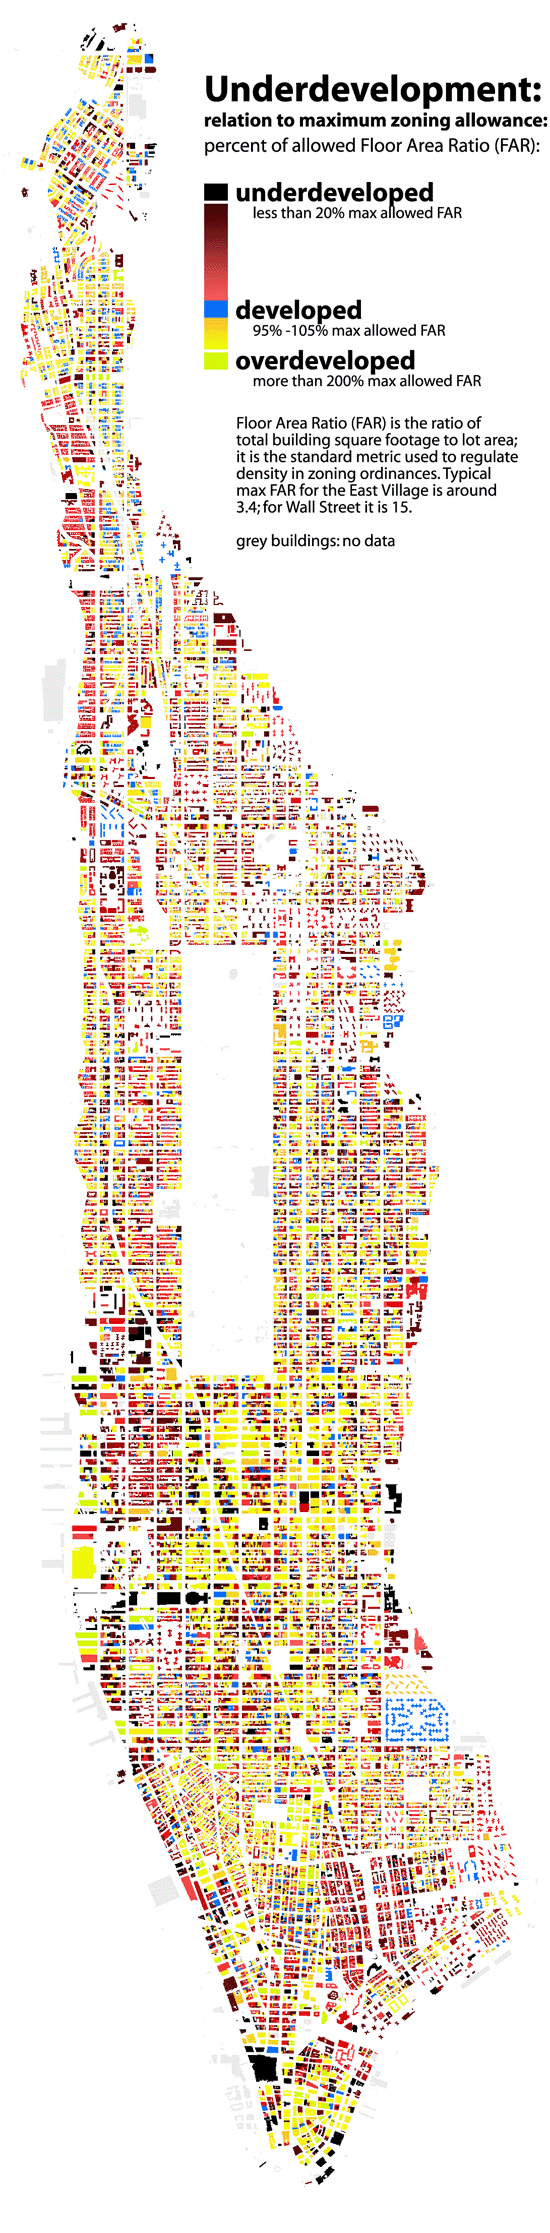
Areas where buildings are using all or almost all of the available FAR have a high intensity of development; areas where buildings are using a low percentage of their permitted floor area have a low intensity of development. Rather than analyzing how zoning restricts development, this method identifies how close buildings are getting to the theoretical “envelope” determined by zoning. It can be very useful for analyzing the market.
My maps compare to yours in interesting ways — not only does midtown Manhattan have a high intensity of development according to my maps, but market forces are actually pushing it to develop more according to yours. Manhattan, on the whole, has a very high intensity of development. While you address the issues with land-value assessments, I must say that in my experience working with them I’ve found them to be highly inaccurate, especially as predictors of future sales. Propertyshark.com sales records are a bit tougher to work with and exist for far fewer sites, but in my experience, much more accurate for region-wide property value estimates.
...
From: Bill Rankin
To: Joshua Jackson
Date: March 13, 2006
Subject: Re: NYC underdevelopment map
Thanks for your note! It's great to hear from people who spend a lot more time thinking about this stuff than I do. You're right that your FAR maps are probably much more useful for making planning decisions, and I wouldn't be surprised if ultimately you and I are trying to map different things. My maps were meant mostly as a meditation upon the (completely fictional, perhaps even "academic") idea of a perfect market, which would exclude things like zoning. The idea being that given a few (absurdly) simplifying assumptions — that the market is rational, frictionless, elastic, and unified — one reaches the perverse conclusion that midtown should theoretically be much more built up than it already is. In some sense it could be read to identify areas where zoning (or other market constraints like elevator efficiency or structural engineering) are preventing greater development, meaning that it would indeed be almost the inverse of an FAR/maxFAR map. (I know that it's problematic to suggest that all of Manhattan is one market, and even a fictional ideal market should somehow take into account transportation.)
So the map is primarily a thought experiment pointing out that the market is far from the "rational" ideal that many people seem to assume. It's also more a didactic point about public buildings and housing projects as it is an attempt to quantify the actual market (which is why I chose to use the complete yet dubious tax assessment data instead of spottier but accurate property sale data). One of the things which did appear with my "underdevelopment" map was the difference between midtown and downtown: midtown stands out as an "underdeveloped" area, while Wall St. seems continuous with its surroundings. I don't know if this is just due to 9/11 (given the relative unresponsiveness of tax assessment data, perhaps not?), but just looking at the map it seems there's much less market pressure downtown, which doesn't show up on maps of value alone.
All this is not to say that the map isn't probably misleading. If it's ok with you I may end up adding another map using FAR data; I'll be sure to give you credit for the idea, perhaps with text from your email. (Or let me know if you already have maps in a format suitable for putting on the site.) An FAR map could probably be better labeled "underdevelopment," while my map might get renamed to make it more clear that it doesn't really address reality.
...
From: Joshua Jackson
To: Bill Rankin
Date: March 15, 2006
Subject: Re: NYC underdevelopment map
On the first topic of mapping underdevelopment, I think you're right that we were mapping different things. Your maps, if I understand correctly, are trying to measure demand versus space, assuming that in an ideal market the built environment would expand to supply those who want to be in a specific place. I'm a lousy economist — is this right? According to what you've produced, it is abundantly clear than the built environment of midtown Manhattan is not keeping up with demand despite bring at the limits of permissible development. Is there any chance that the "Plaza Bonus," which permits developers to use greater FAR if they reserve 20% of their lot for public space on the ground, is affecting this analysis? This bonus may be partially responsible for both taller buildings (since lesser lot coverage encourages tall and thin buildings) and for some of the greater assessed value since the buildings will be assessed based on their greater total floor area.
As for using FAR data, I would be excited to see if you reached any new conclusions using that for an analysis instead of building height. I actually haven't done a citywide map of FAR or the FAR/MaxFAR ratio since my work tends to focus on individual neighborhoods. I'd be curious to see how they compare.
...
From: Bill Rankin
To: Joshua Jackson
Date: April 3, 2006
Subject: Re: NYC underdevelopment map
I've finally been able to make that Manhattan FAR map. You're right that the island is pretty generally developed up to the zoning envelope; only a few areas seem really "underdeveloped" (such as around the Bowery, or Midtown West), while Midtown and Wall St. are indeed quite "overdeveloped" (as is Washington Square, oddly enough). I think you're right about the influence of the exchange of FAR for "public space" (do you know Jerold Kayden's Privately Owned Public Space? It's all about that policy). I also think it's interesting that there aren't really areas that conform uniformly to the zoning envelope. The colors on the map look more like random white noise than a patchwork of defined areas. (And thus it took me quite a while to find a color scale I was happy with.) I also wonder how much micro-managing of max-FAR goes on.. the zoning map definitely looks more complicated than the original 1916 plan that I know as a historian.
Of course this doesn't show the whole city, just Manhattan. Unfortunately, it's the only data to which I have easy access. I'll keep my eyes out for more.
So anyway, I've put the map here. I'd love to hear any thoughts you may have.
