Bill Rankin, 2014
download:
PNG (2550x2100, 325 kB)
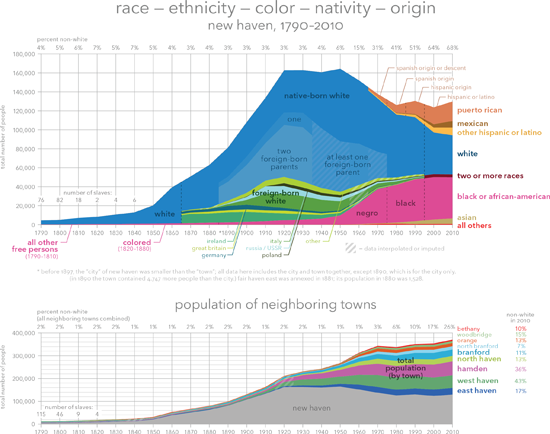
Most maps show only a shapshot in time (including mine), but of course city demographics have changed dramatically over the course of New Haven's 375-year history. This simple graph is a first attempt to grapple with these changes.
Despite the simple graphics, however, this map was surprisingly difficult to create. Not only are the numbers buried in old reports (city-level data are not available through nhgis.org before 1910), but the categories used by the census have also changed significantly. Showing long-term trends required some interpolation and imputation, while respecting historical categories required keeping some of my data-crunching impulses in check.
One large take-away is clear: the categories used by the census have not tracked any coherent biological or geographic characteristics. "Race," "ethnicity," "color," "nativity," and "origin" have all mingled and overlapped, often with absurd results. For example, white and black are races (based on color), but so are Vietnamese (a country) and Hindu (a religion). Hispanic / Latino self-identification has been tracked according to "ethnicity," "origin," "descent," surname, and mother tongue.
The next step is to show this data geographically — but that will require more digging!
All data from the US Census, most of which is available here.
