


Bill Rankin, 2016
click on any image to download high-res version (one pixel = 2 km)
or download all (.ZIP, 23 MB)
Bioregionalism is an attempt to align personal identity with natural regions rather than arbitrary political jurisdictions. But most bioregionalist mapping still relies on the familiar conventions of hard-edged boundaries, with bioregions often defined using the clear lines of, say, watersheds. Yet in reality, most natural transitions are gradual, and within-region homogeneity is rare. A truly radical bioregionalism would not just rearrange the boundaries; it would question the ideal of sharp boundaries altogether.
Forest regions are usually characterized by dominant tree types: oak-hickory, maple-beech-birch, spruce-fir, and so on. The resulting maps can use simple hard edges or high-resolution pointillism, but they all reinforce the idea that forests come in a few basic flavors, with relatively clear distinctions between them.
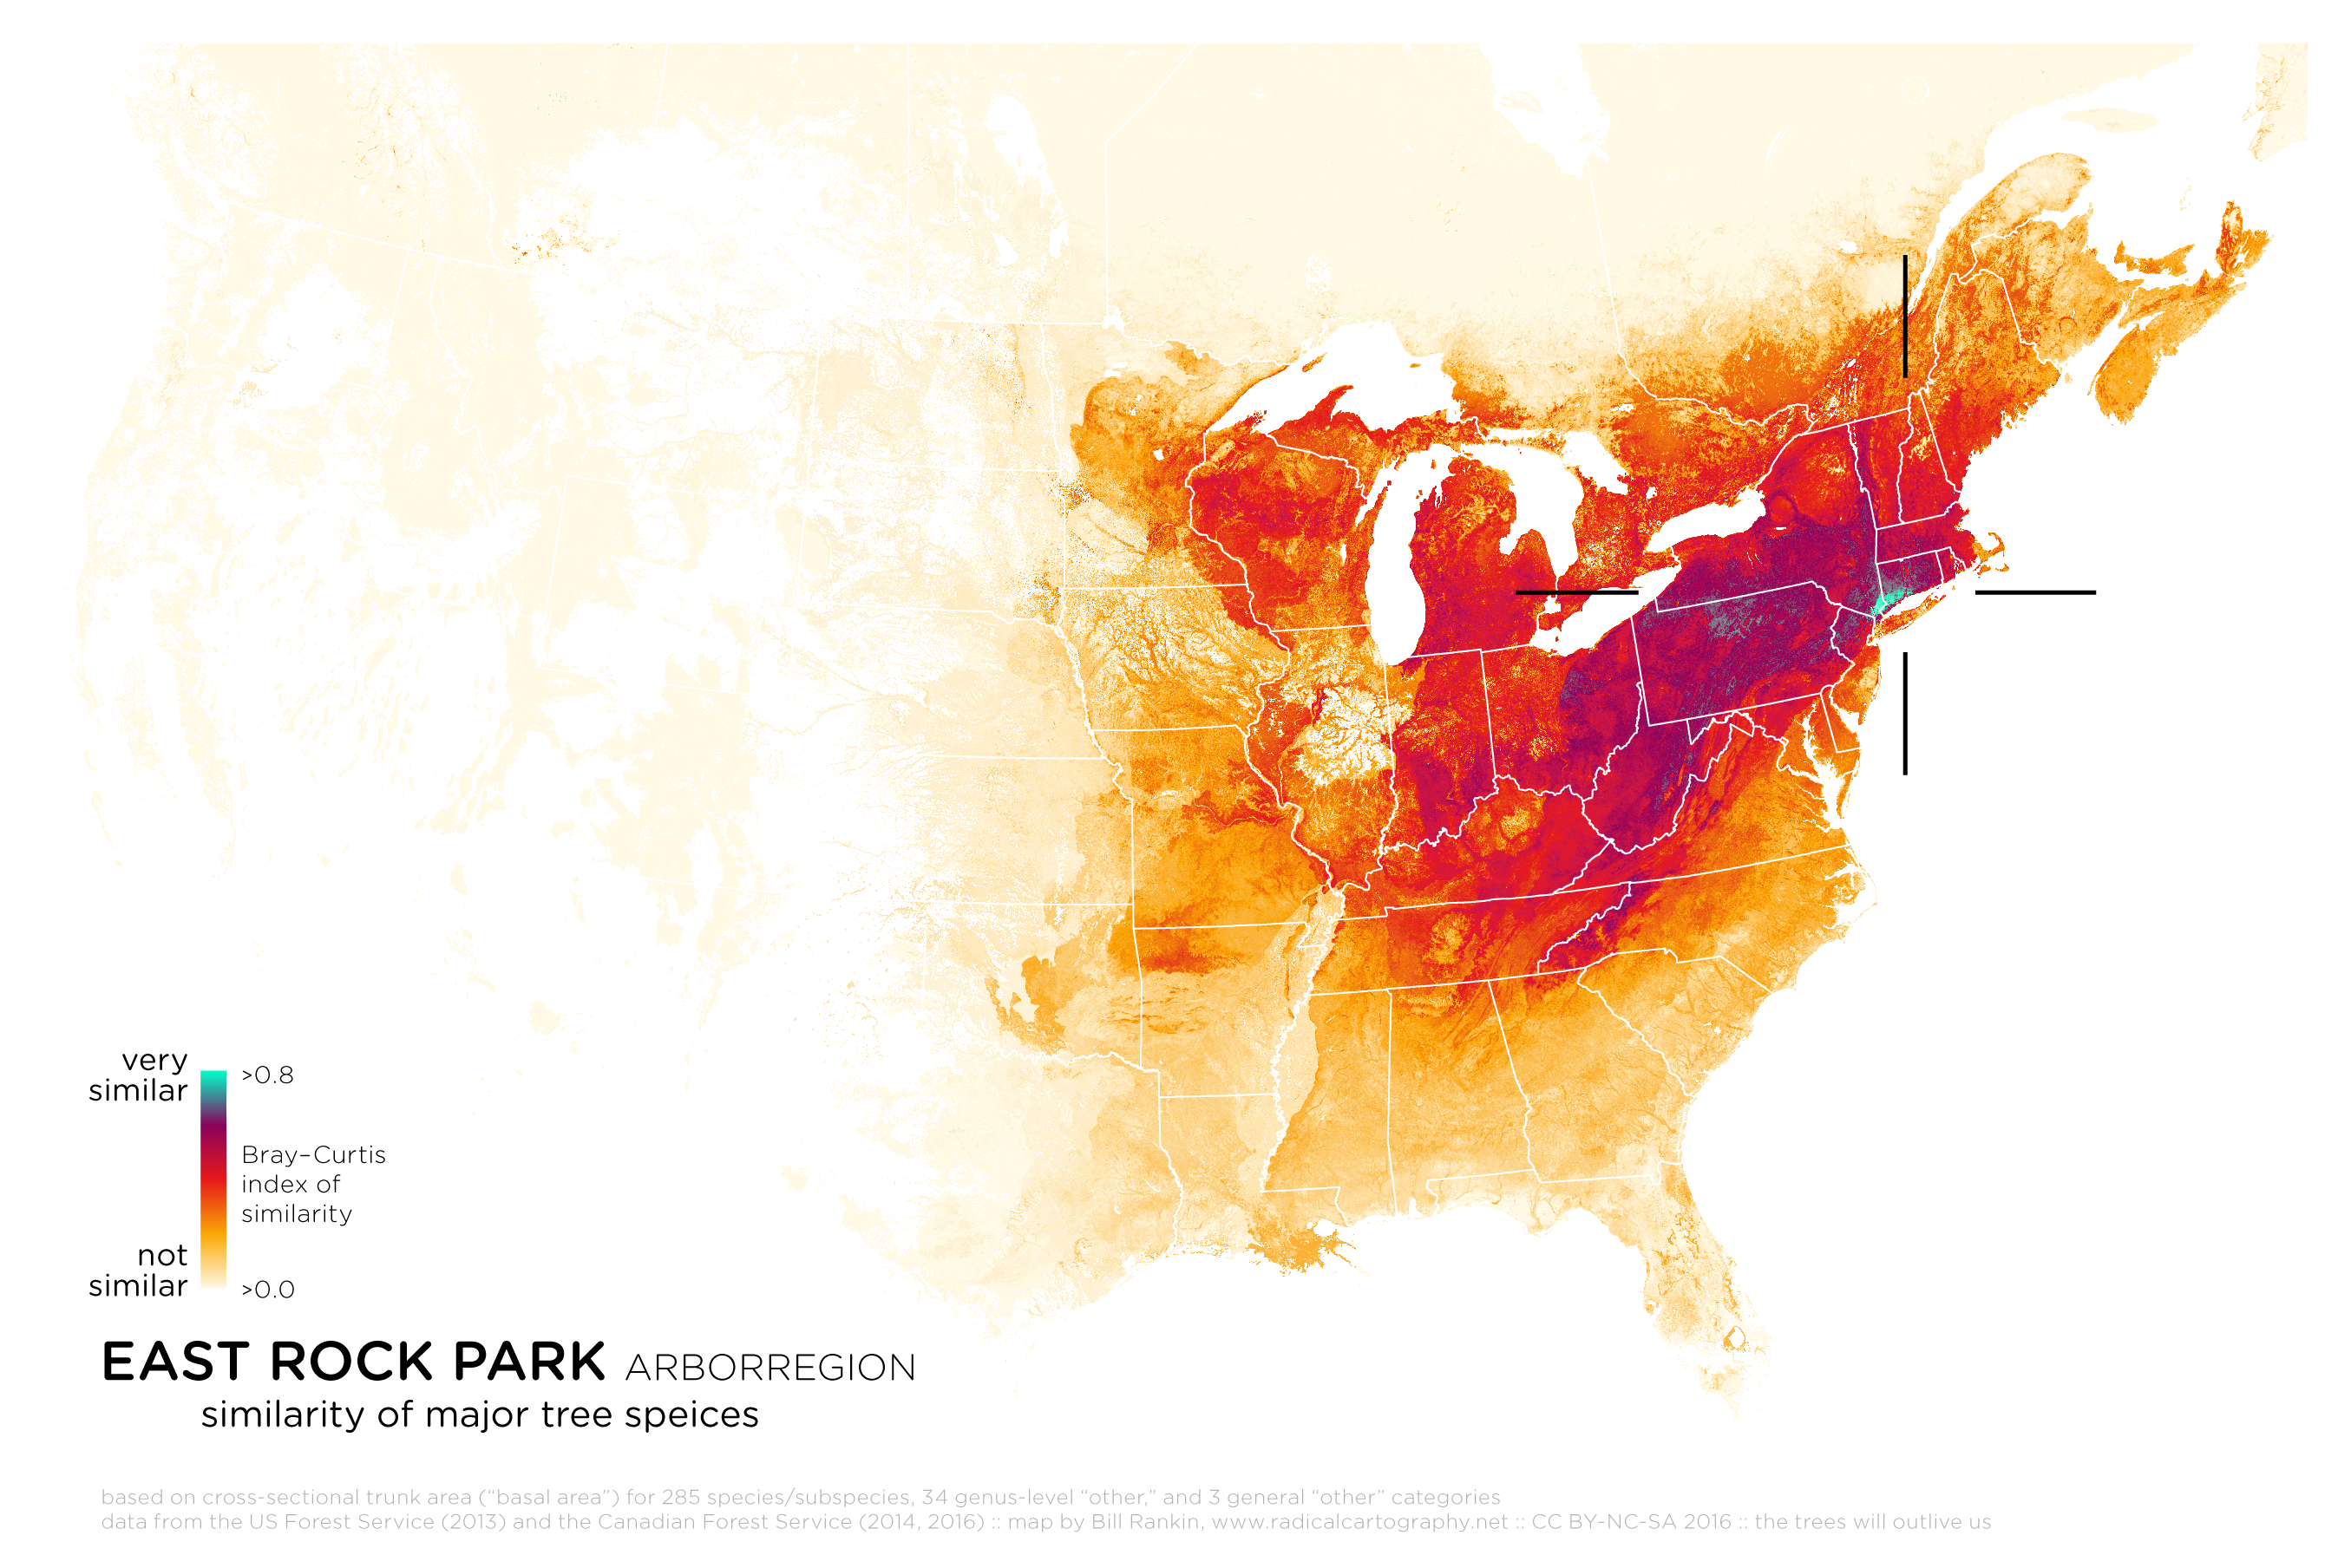
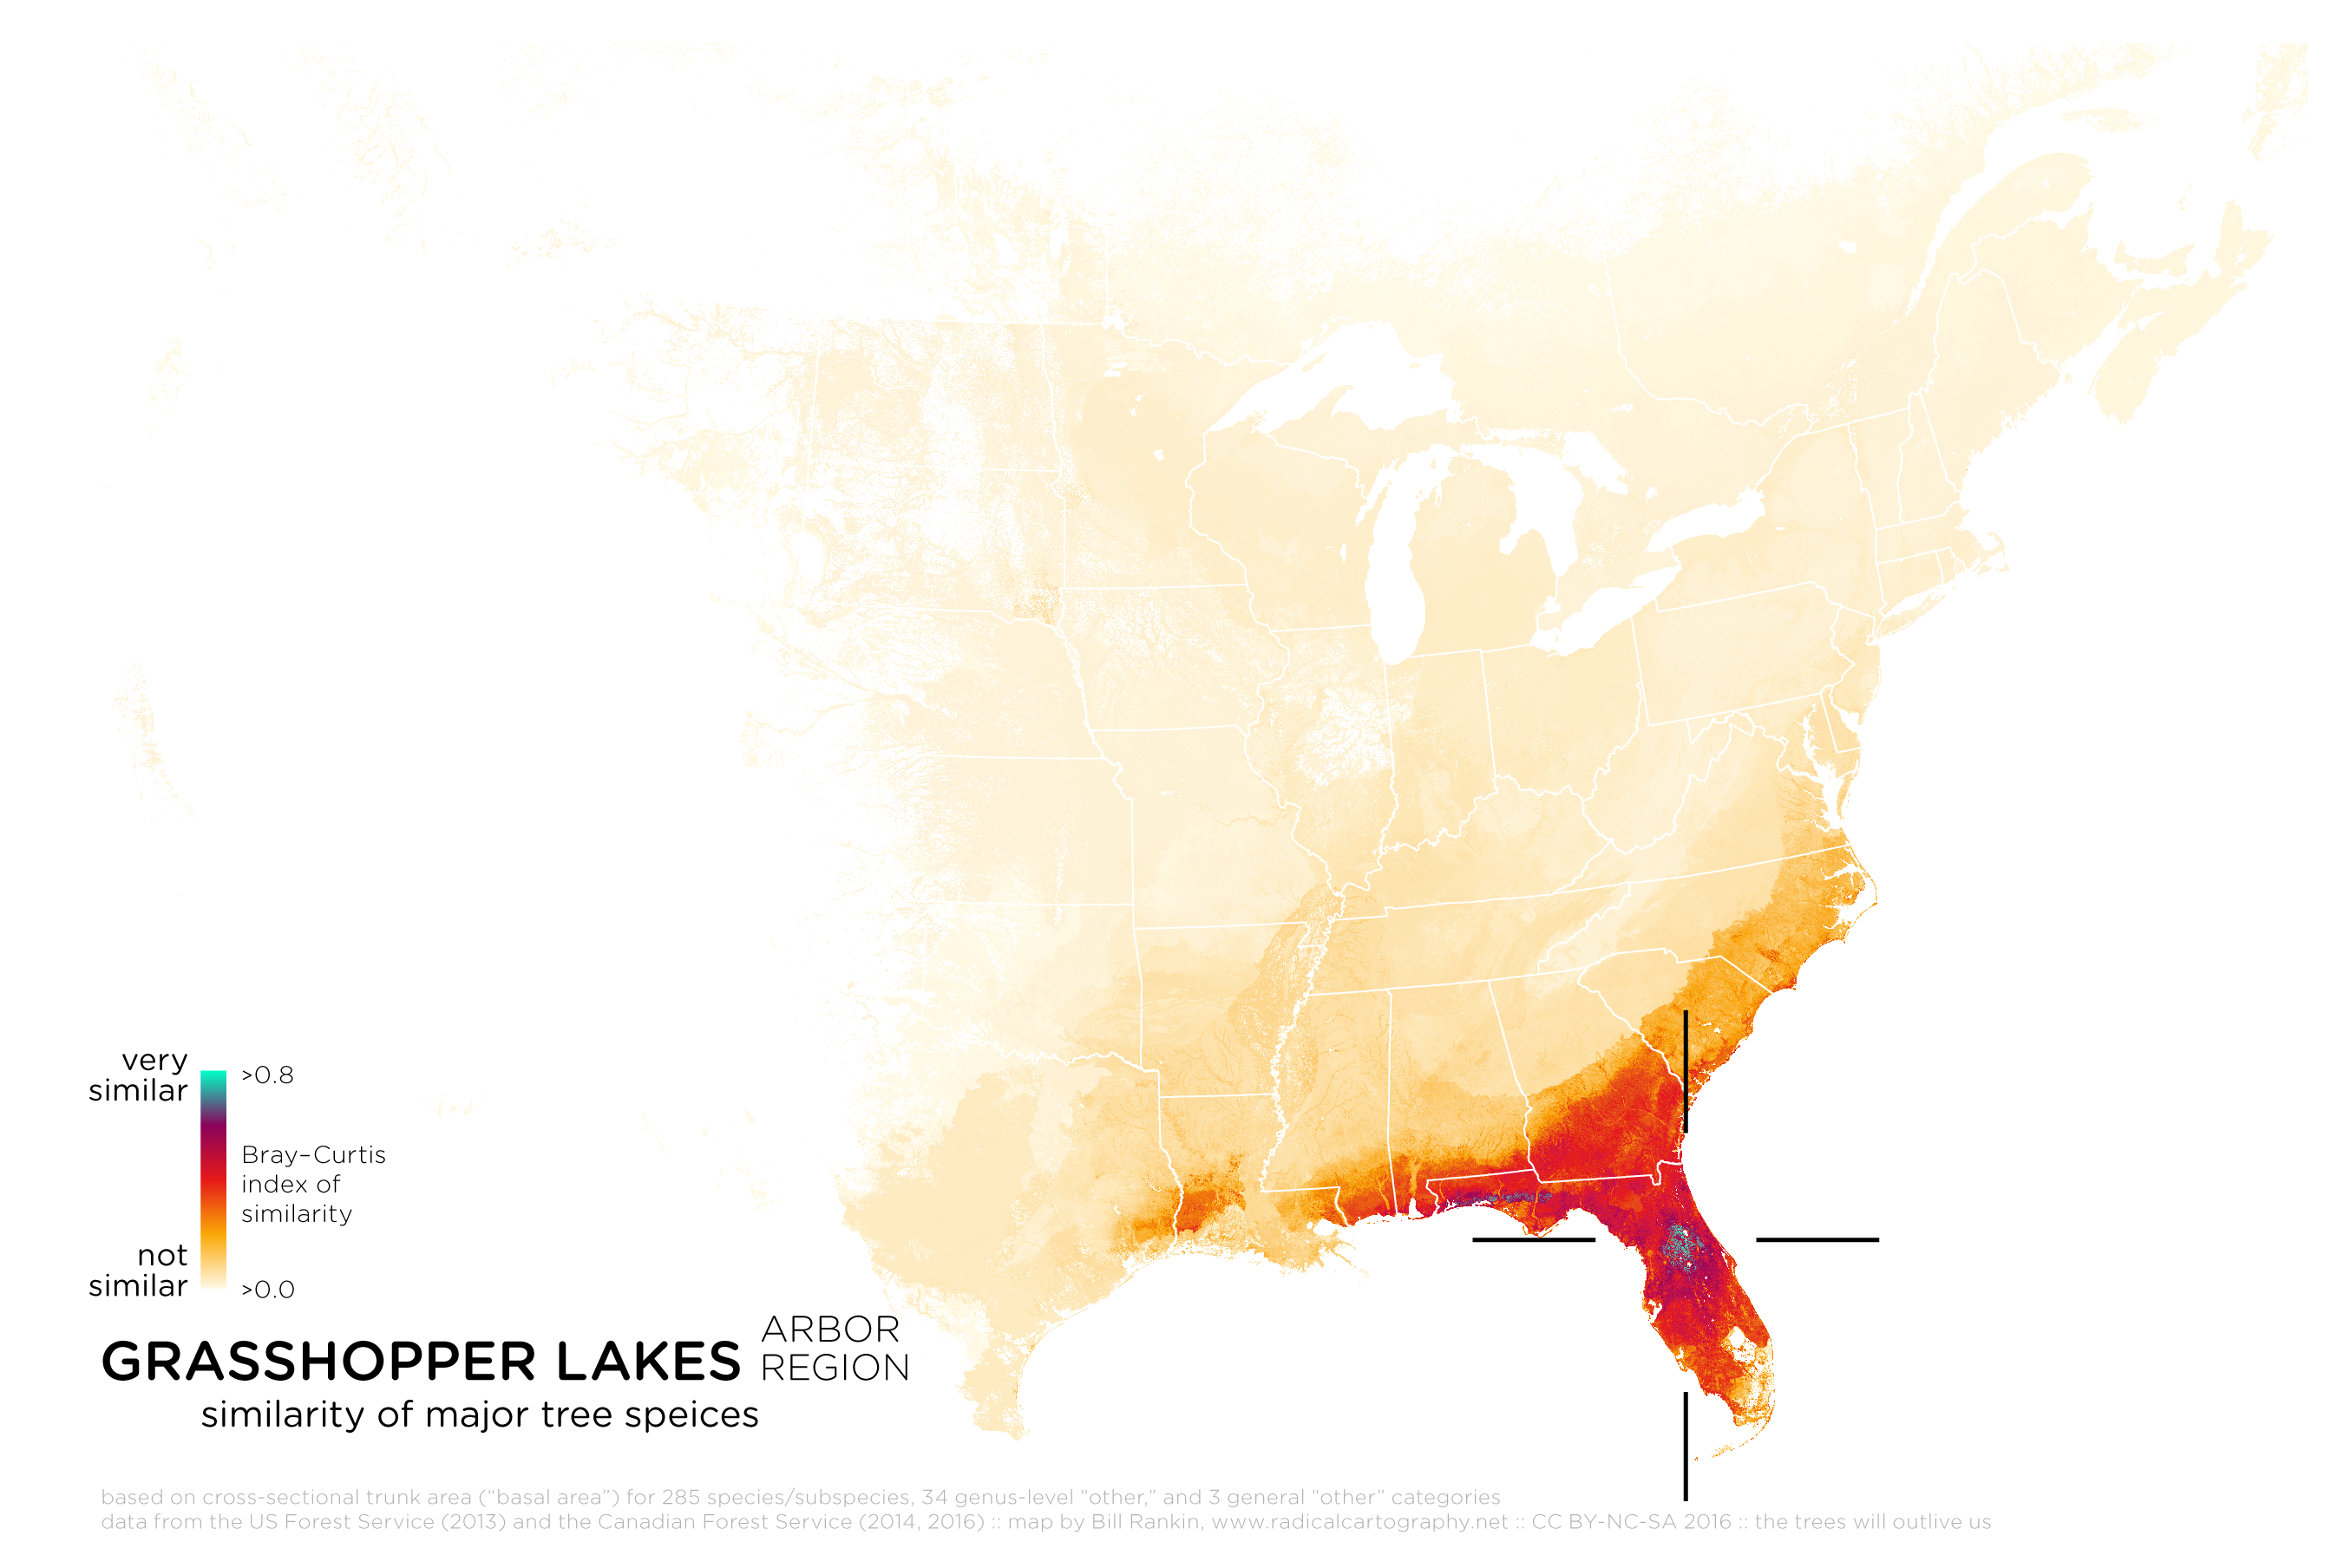
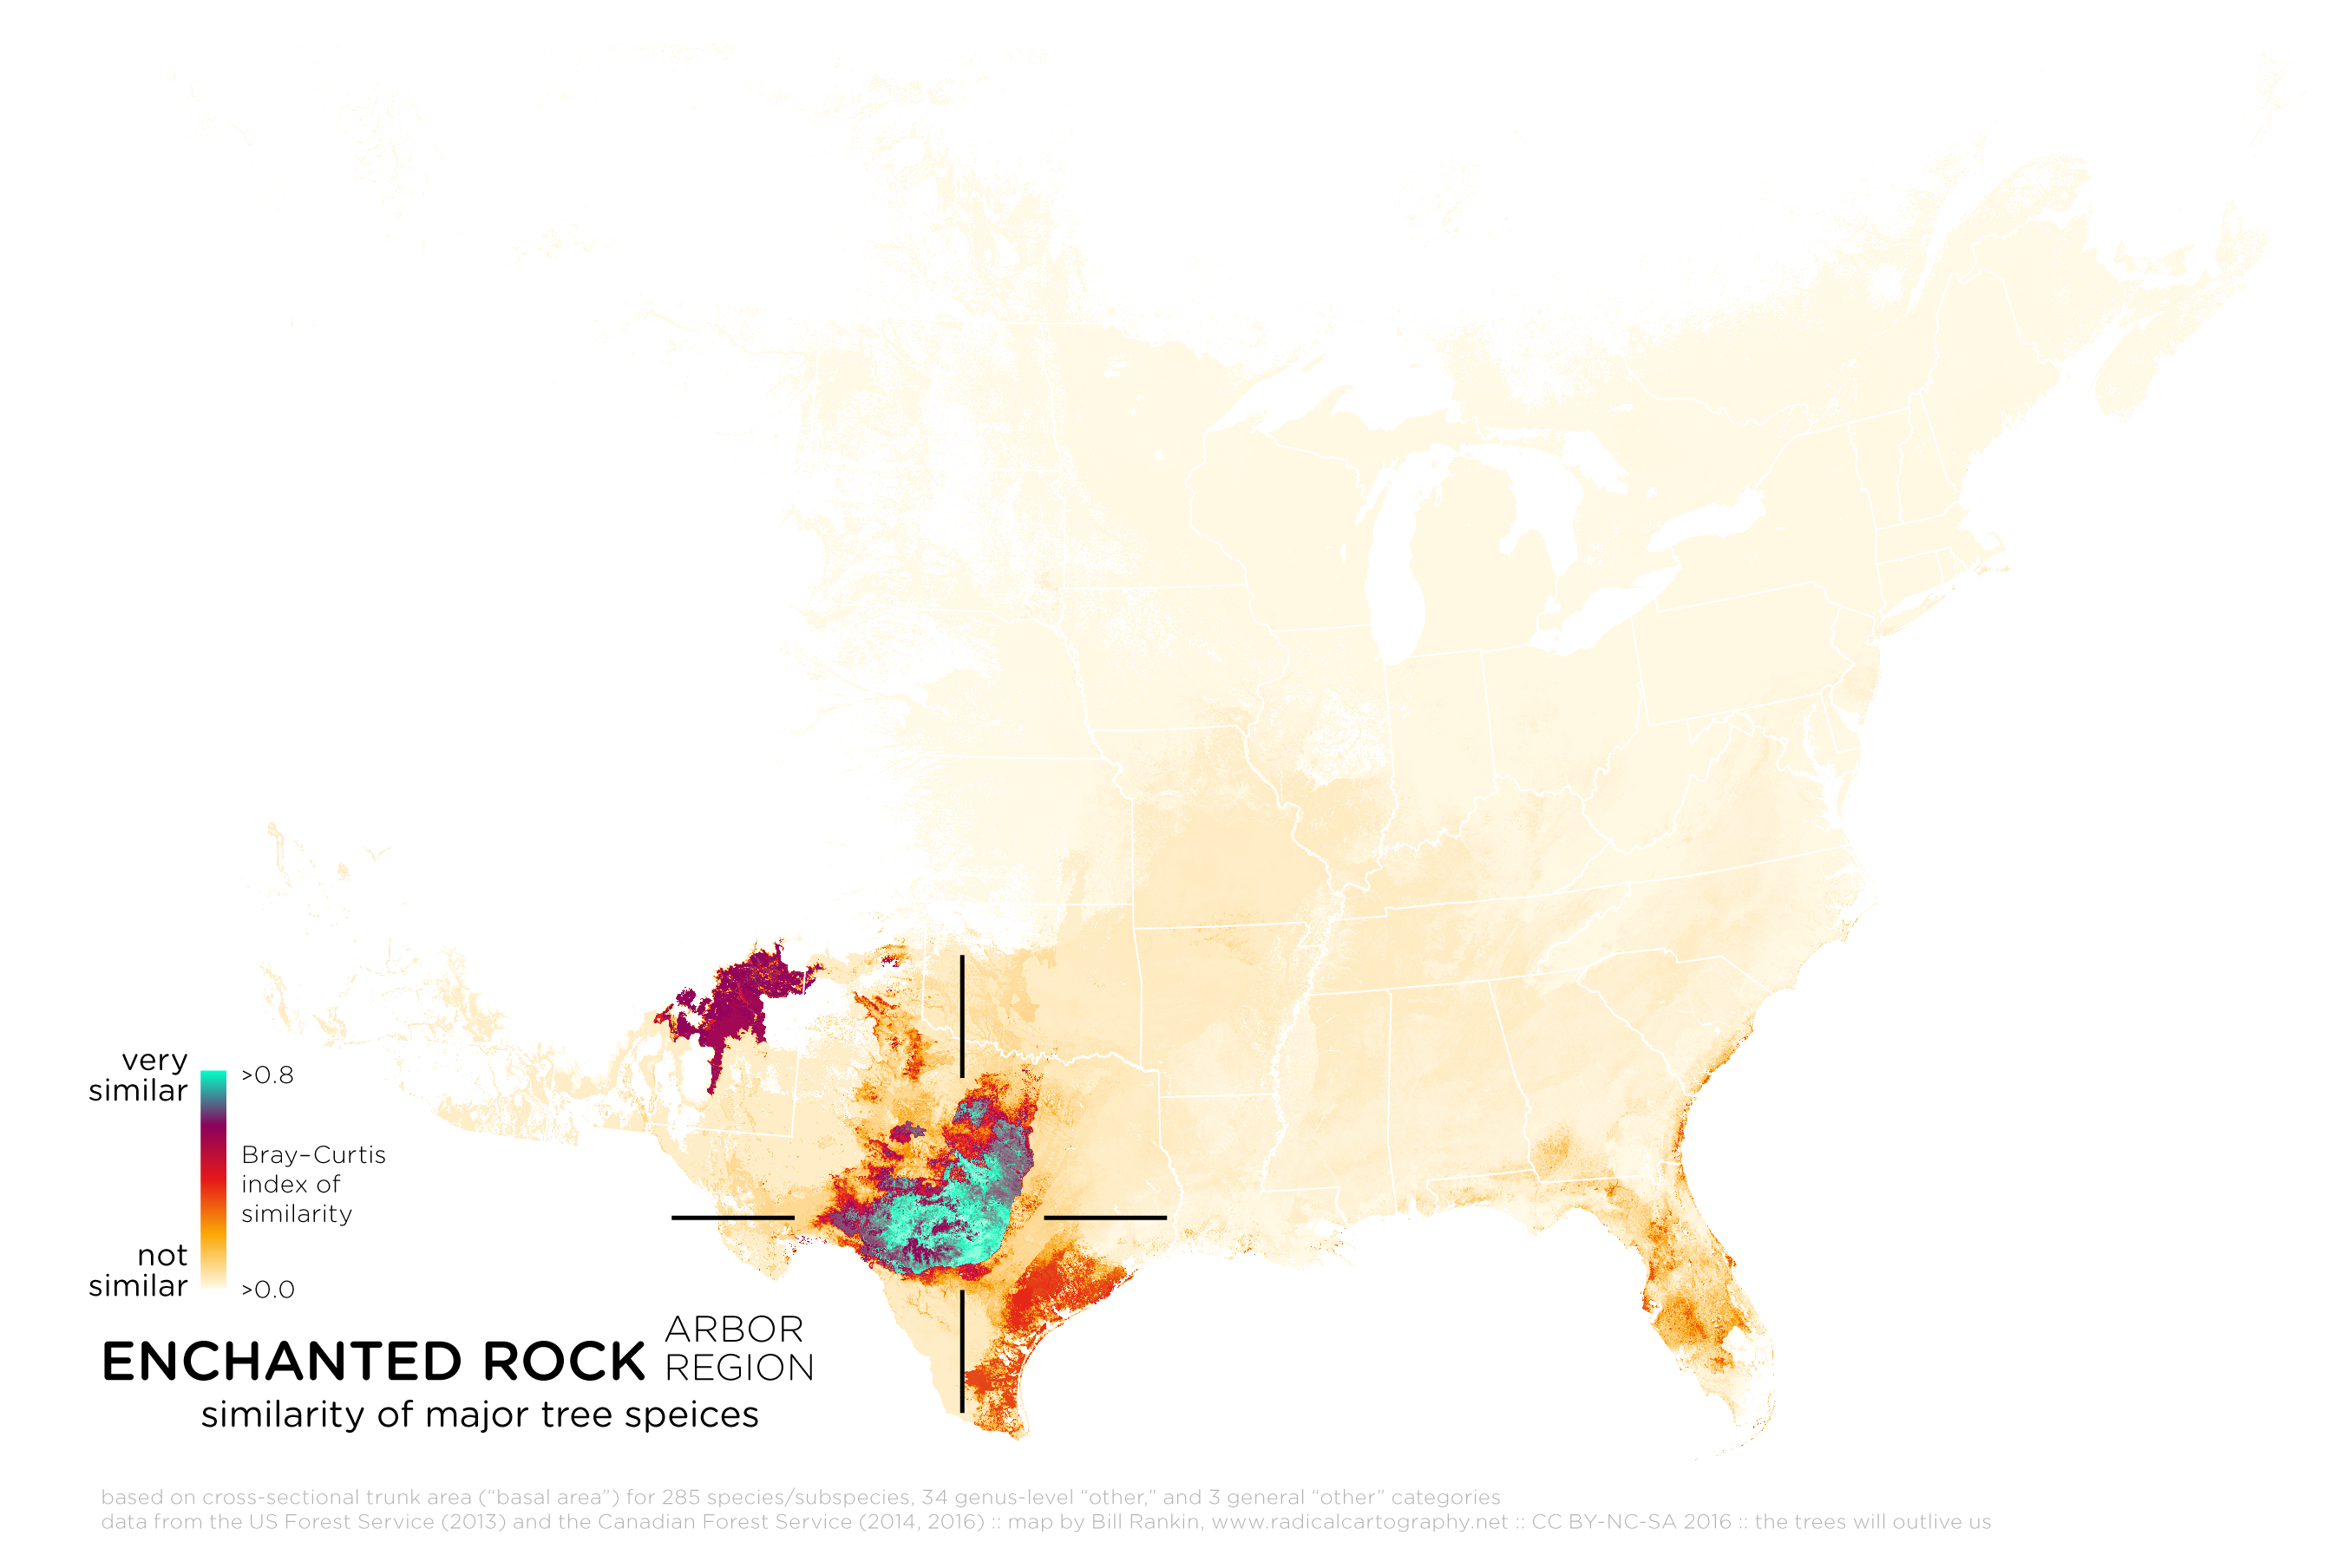
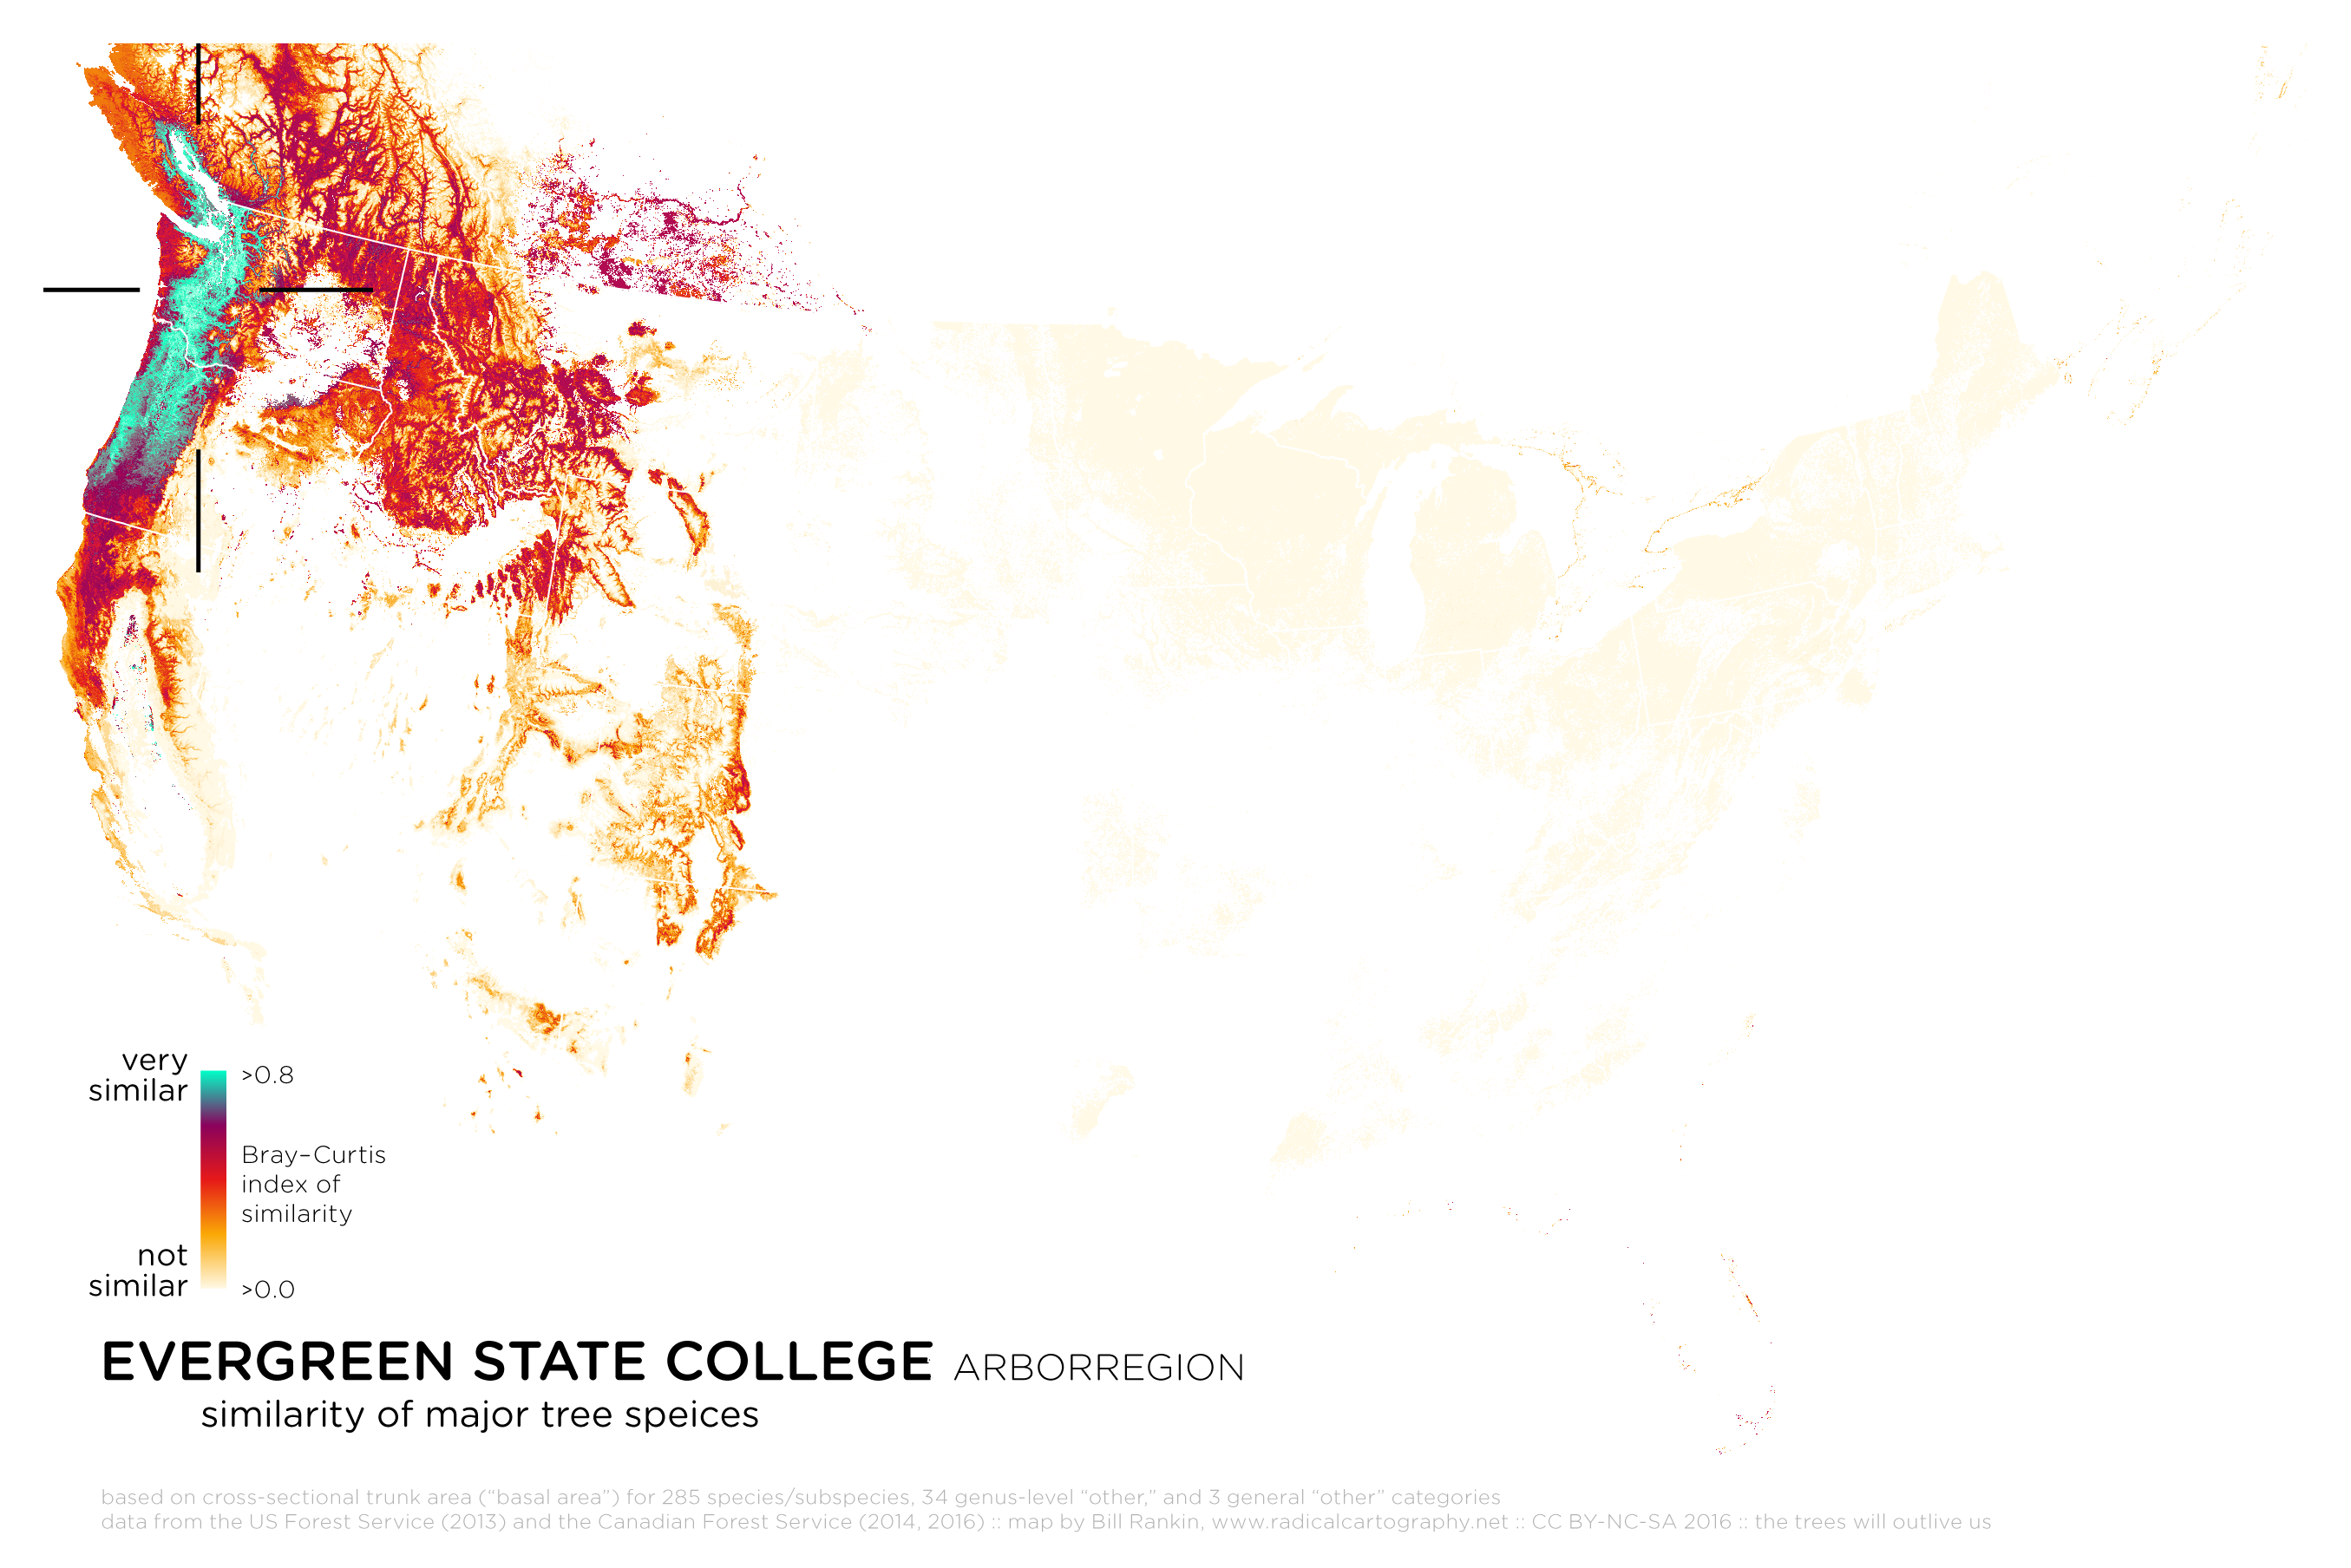
What I'm calling an "arborregion" is a way of turning these typical maps inside out. Instead of dividing the world into distinct regional types, I'm interested in understanding gradients of similarity. Arborregions are thus the personalized counterpart to my unblobbed maps of tree types.
For example, I know the forest near my house quite well. It's a mix of large oaks and smaller hickories, with pockets of mature sugar maple, black birch, and beech. Along the rocky ridges are red-cedar, pitch pine, and post oak, while the river banks are home to black willow, red maple, and various invasives. There are some huge tuliptrees, stands of hemlock, and sassafras in the understory. If I traveled a few hours away, some of these patterns would still be recognizable, but others would not.
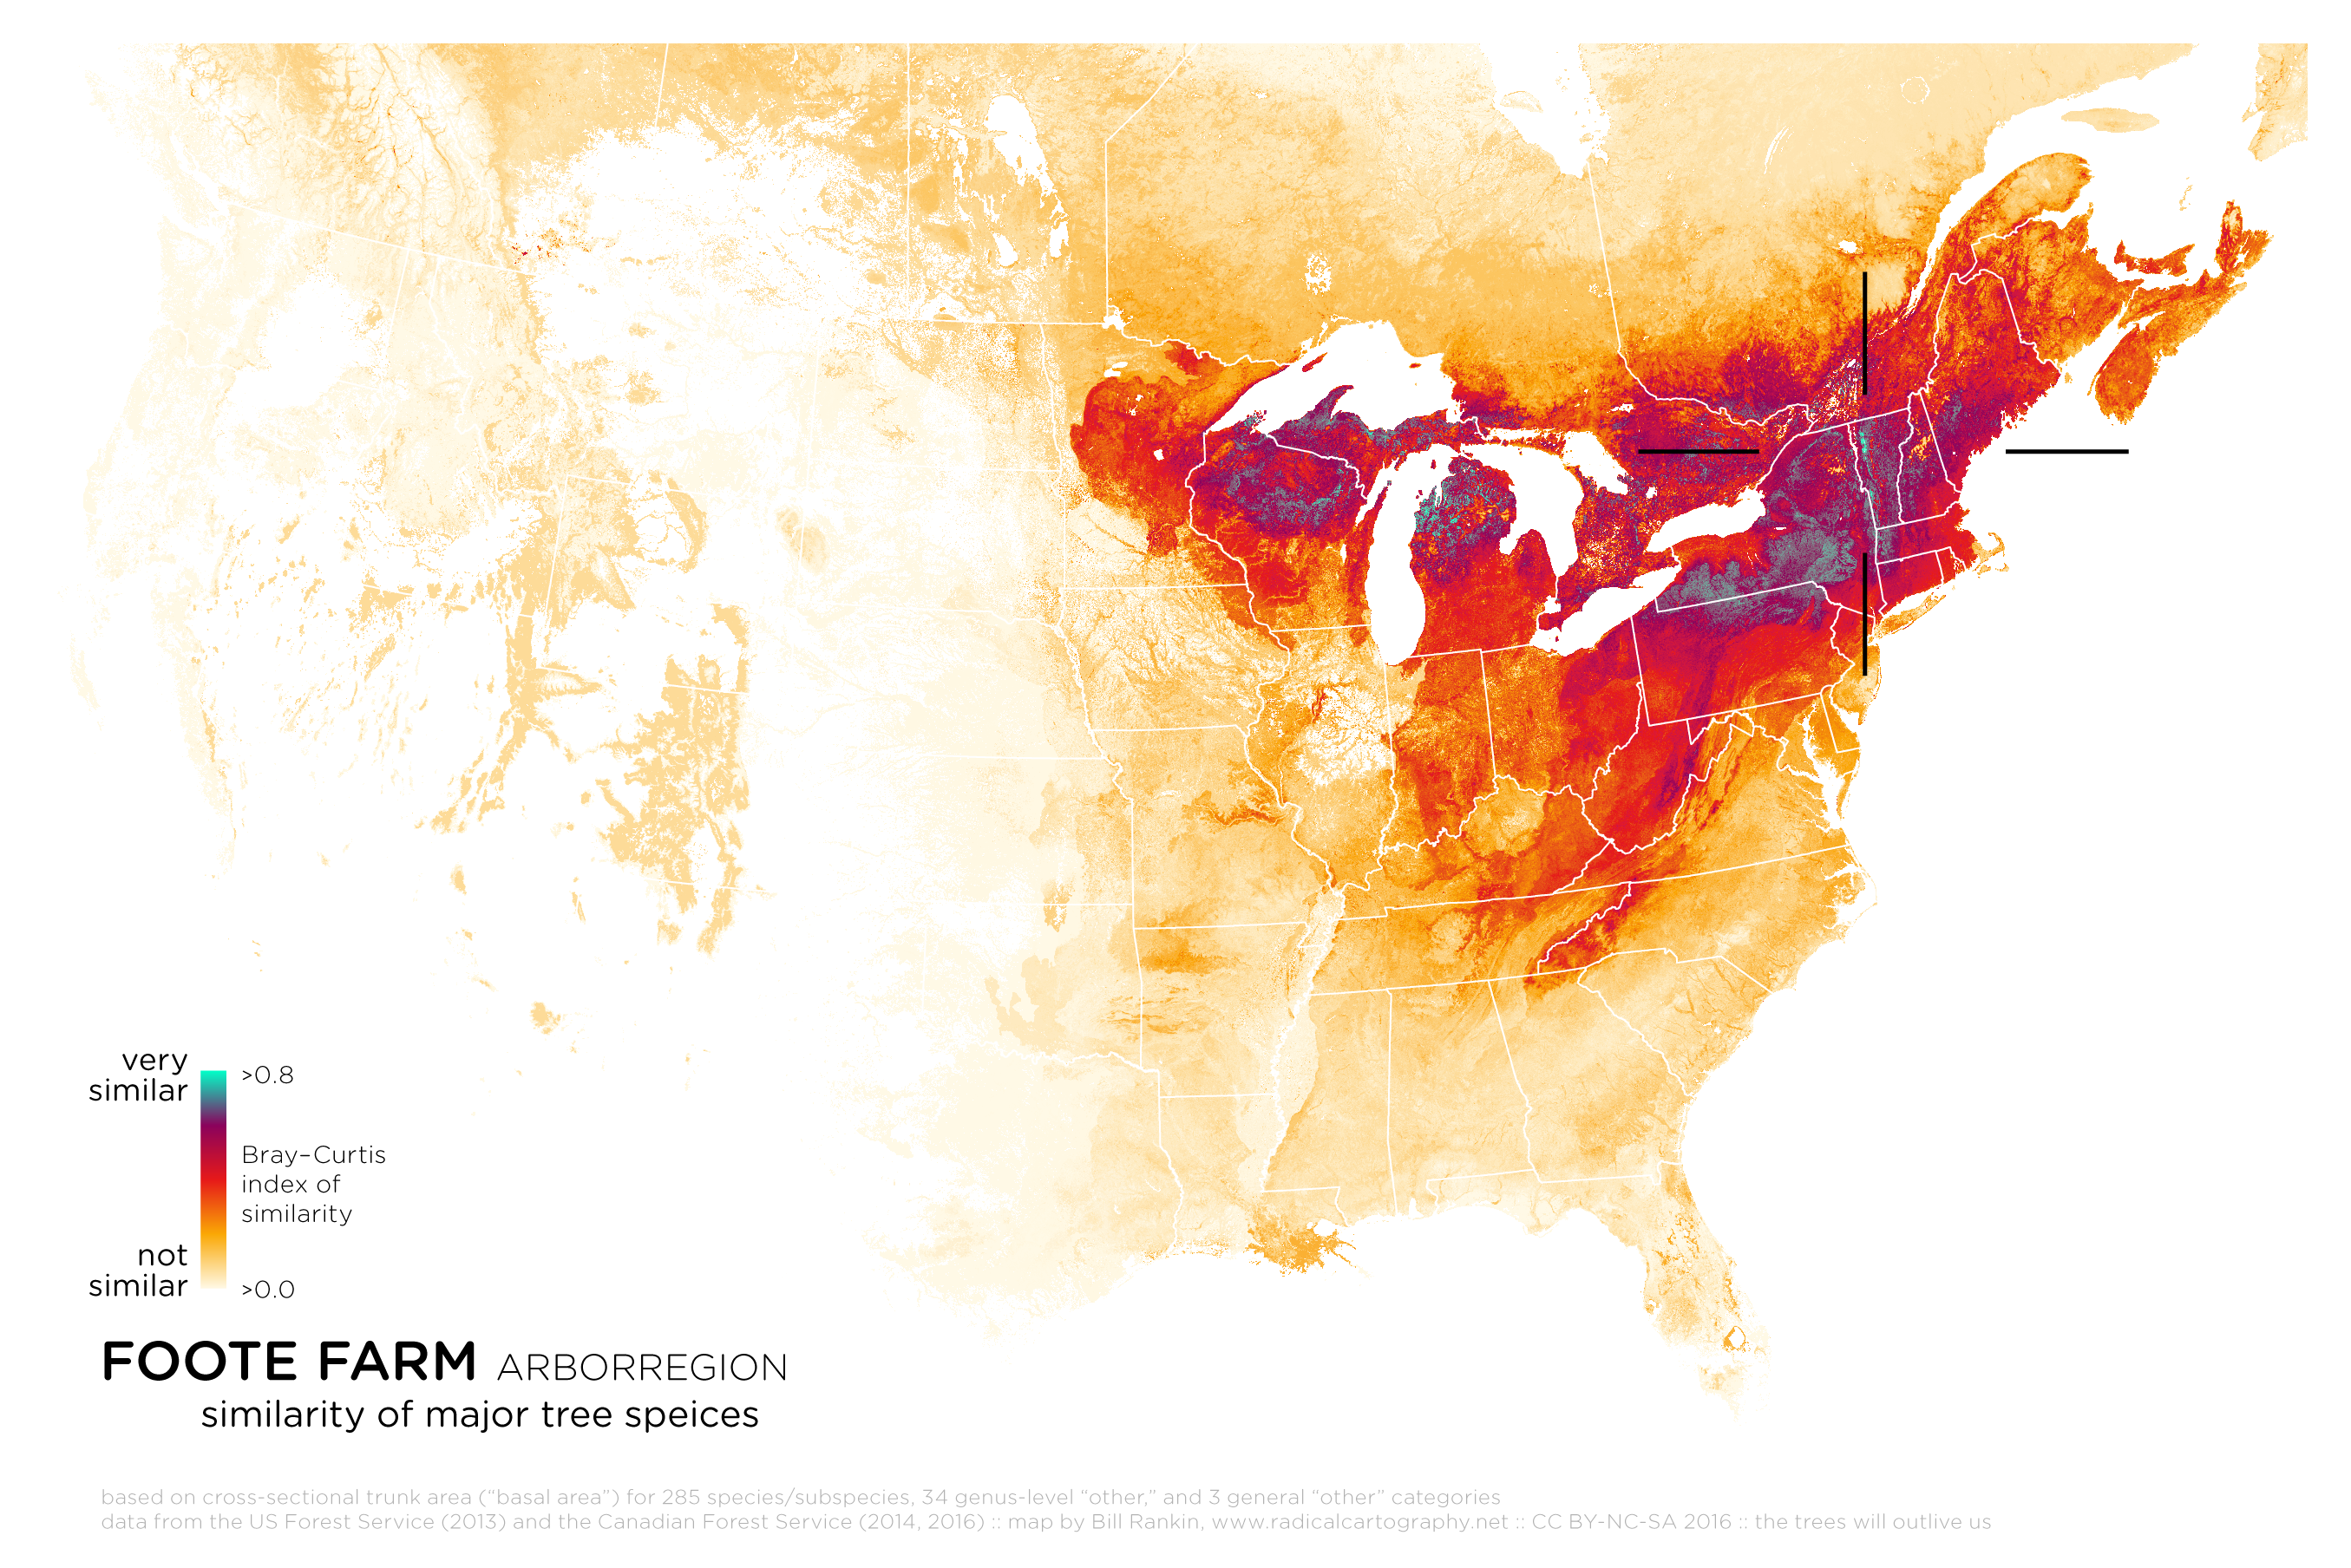
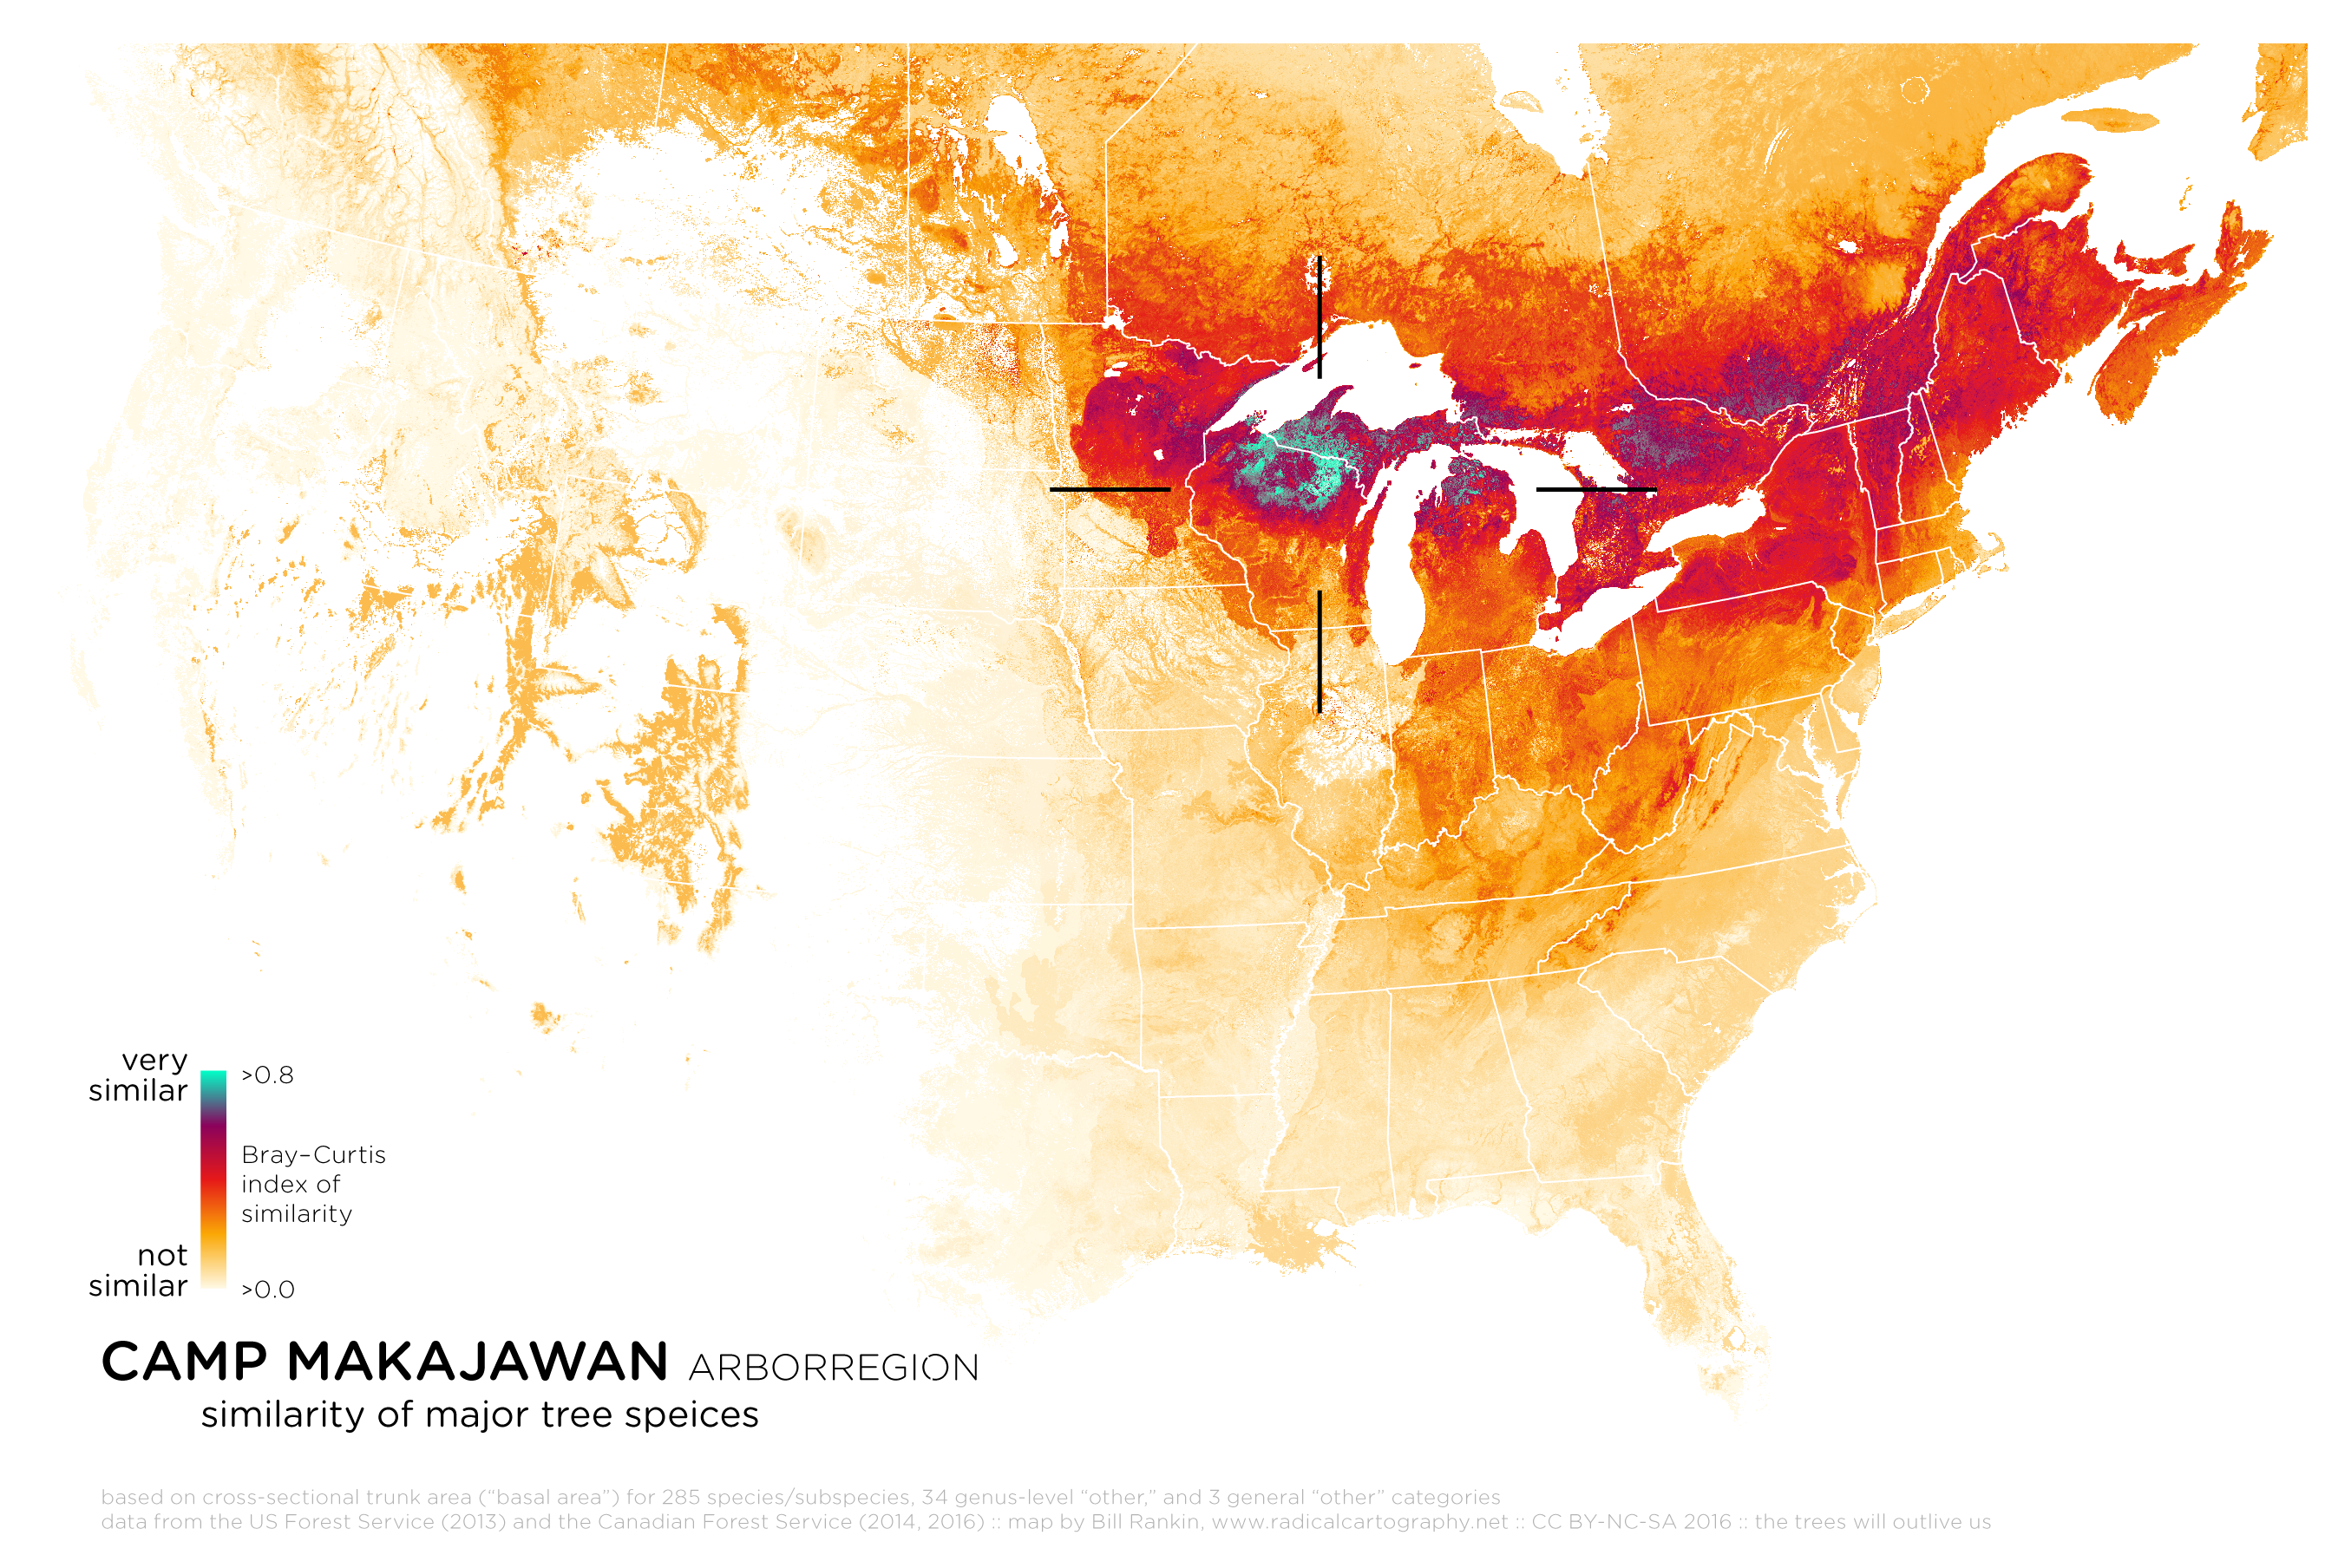
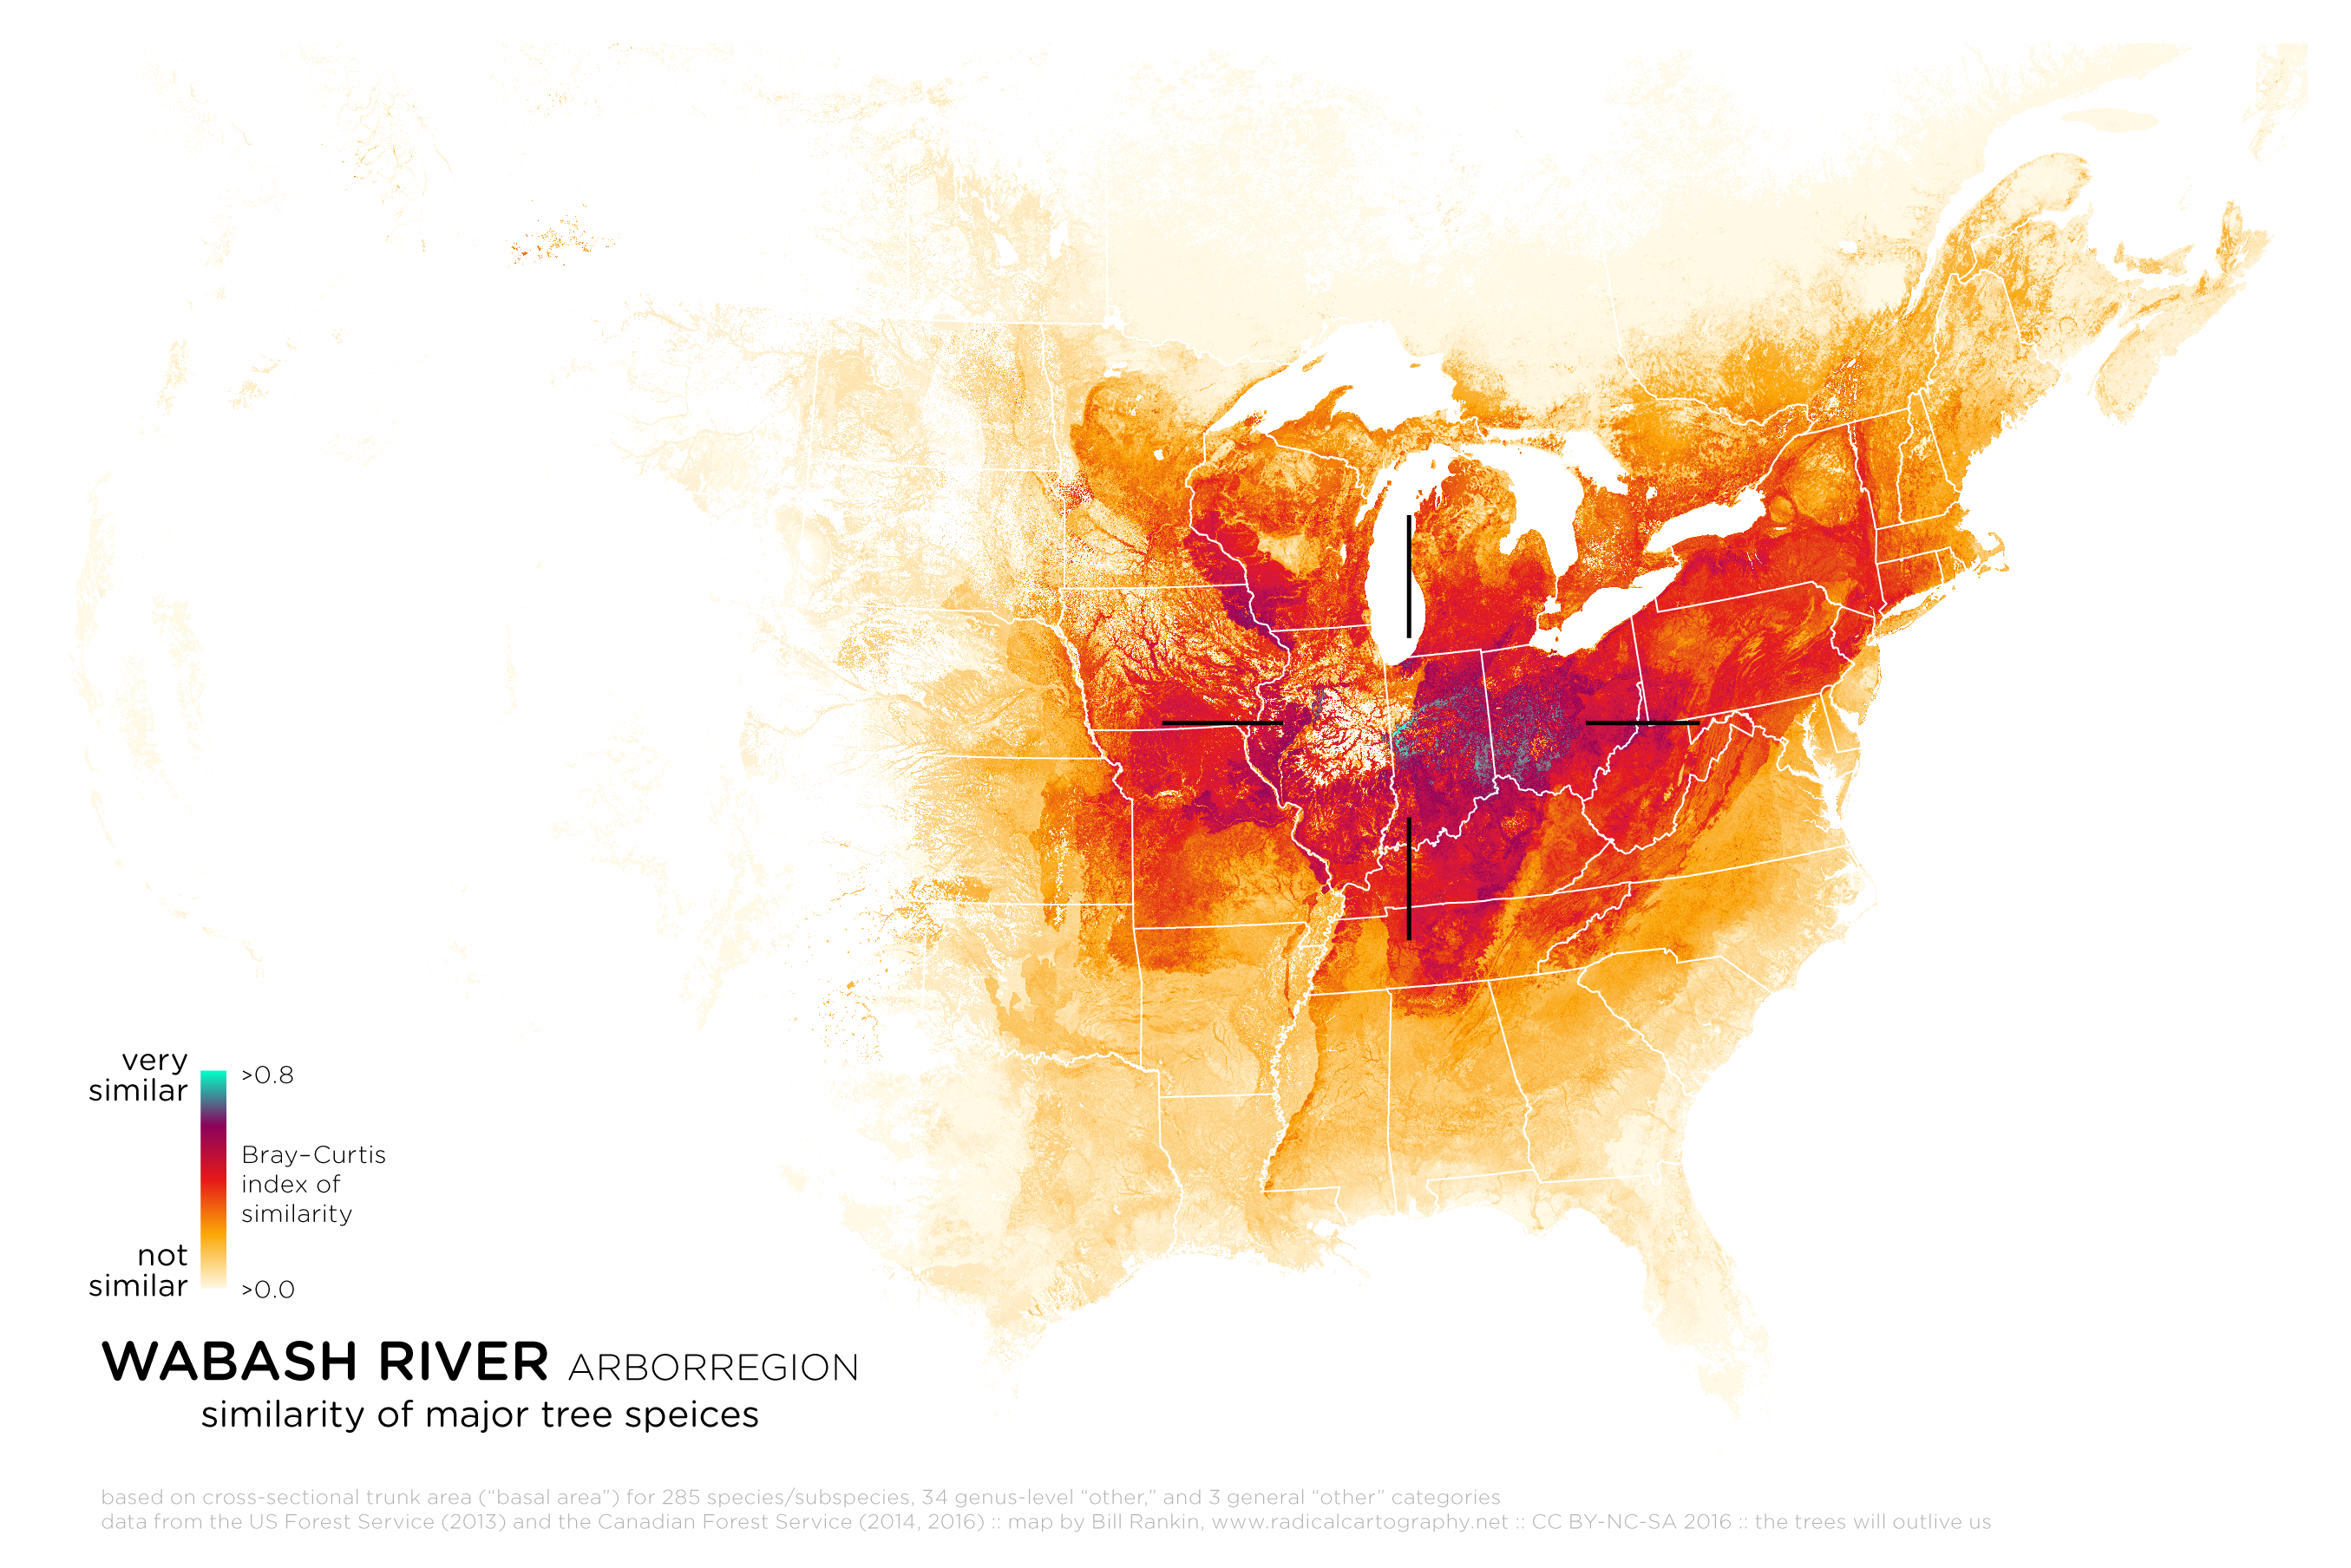
The arborregion maps quantify these differences. The typical pattern is a small area of high similarity (in teal), a larger zone of family resemblance (in purple and red), and then a much larger area with only a few recognizable species (in light orange). But there are also places like the Texas hill country or the Pacific northwest with a high degree of similarity over a very large area. There are also some genuinely abrupt transitions, either with elevation (in the west) or at the edge of a coastal or alluvial plain (in the southeast).
With this kind of mapping, no single synoptic view is possible. Every point gets its own unique map, since bioregions are defined not as discrete puzzle pieces, but as a relationship between a place and its wider surroundings. And there's no reason this same technique couldn't be adapted for other variables as well — climate, seasonality, or even population.
Interested in a map for your own special place? Email me and I'll see what I can do!
Data based on kNN modeling from the US Forest Service (2013) and the Canadian Forest Service (2014, 2016). Discontinuities are due to differences in metrics, modeling, and species selection. No comparable data available for Mexico.