TOP TWENTY: Pine (%), Spruce (%), Fir (%), Oak (%), Maple (%), Douglas-Fir (%), Juniper (%),
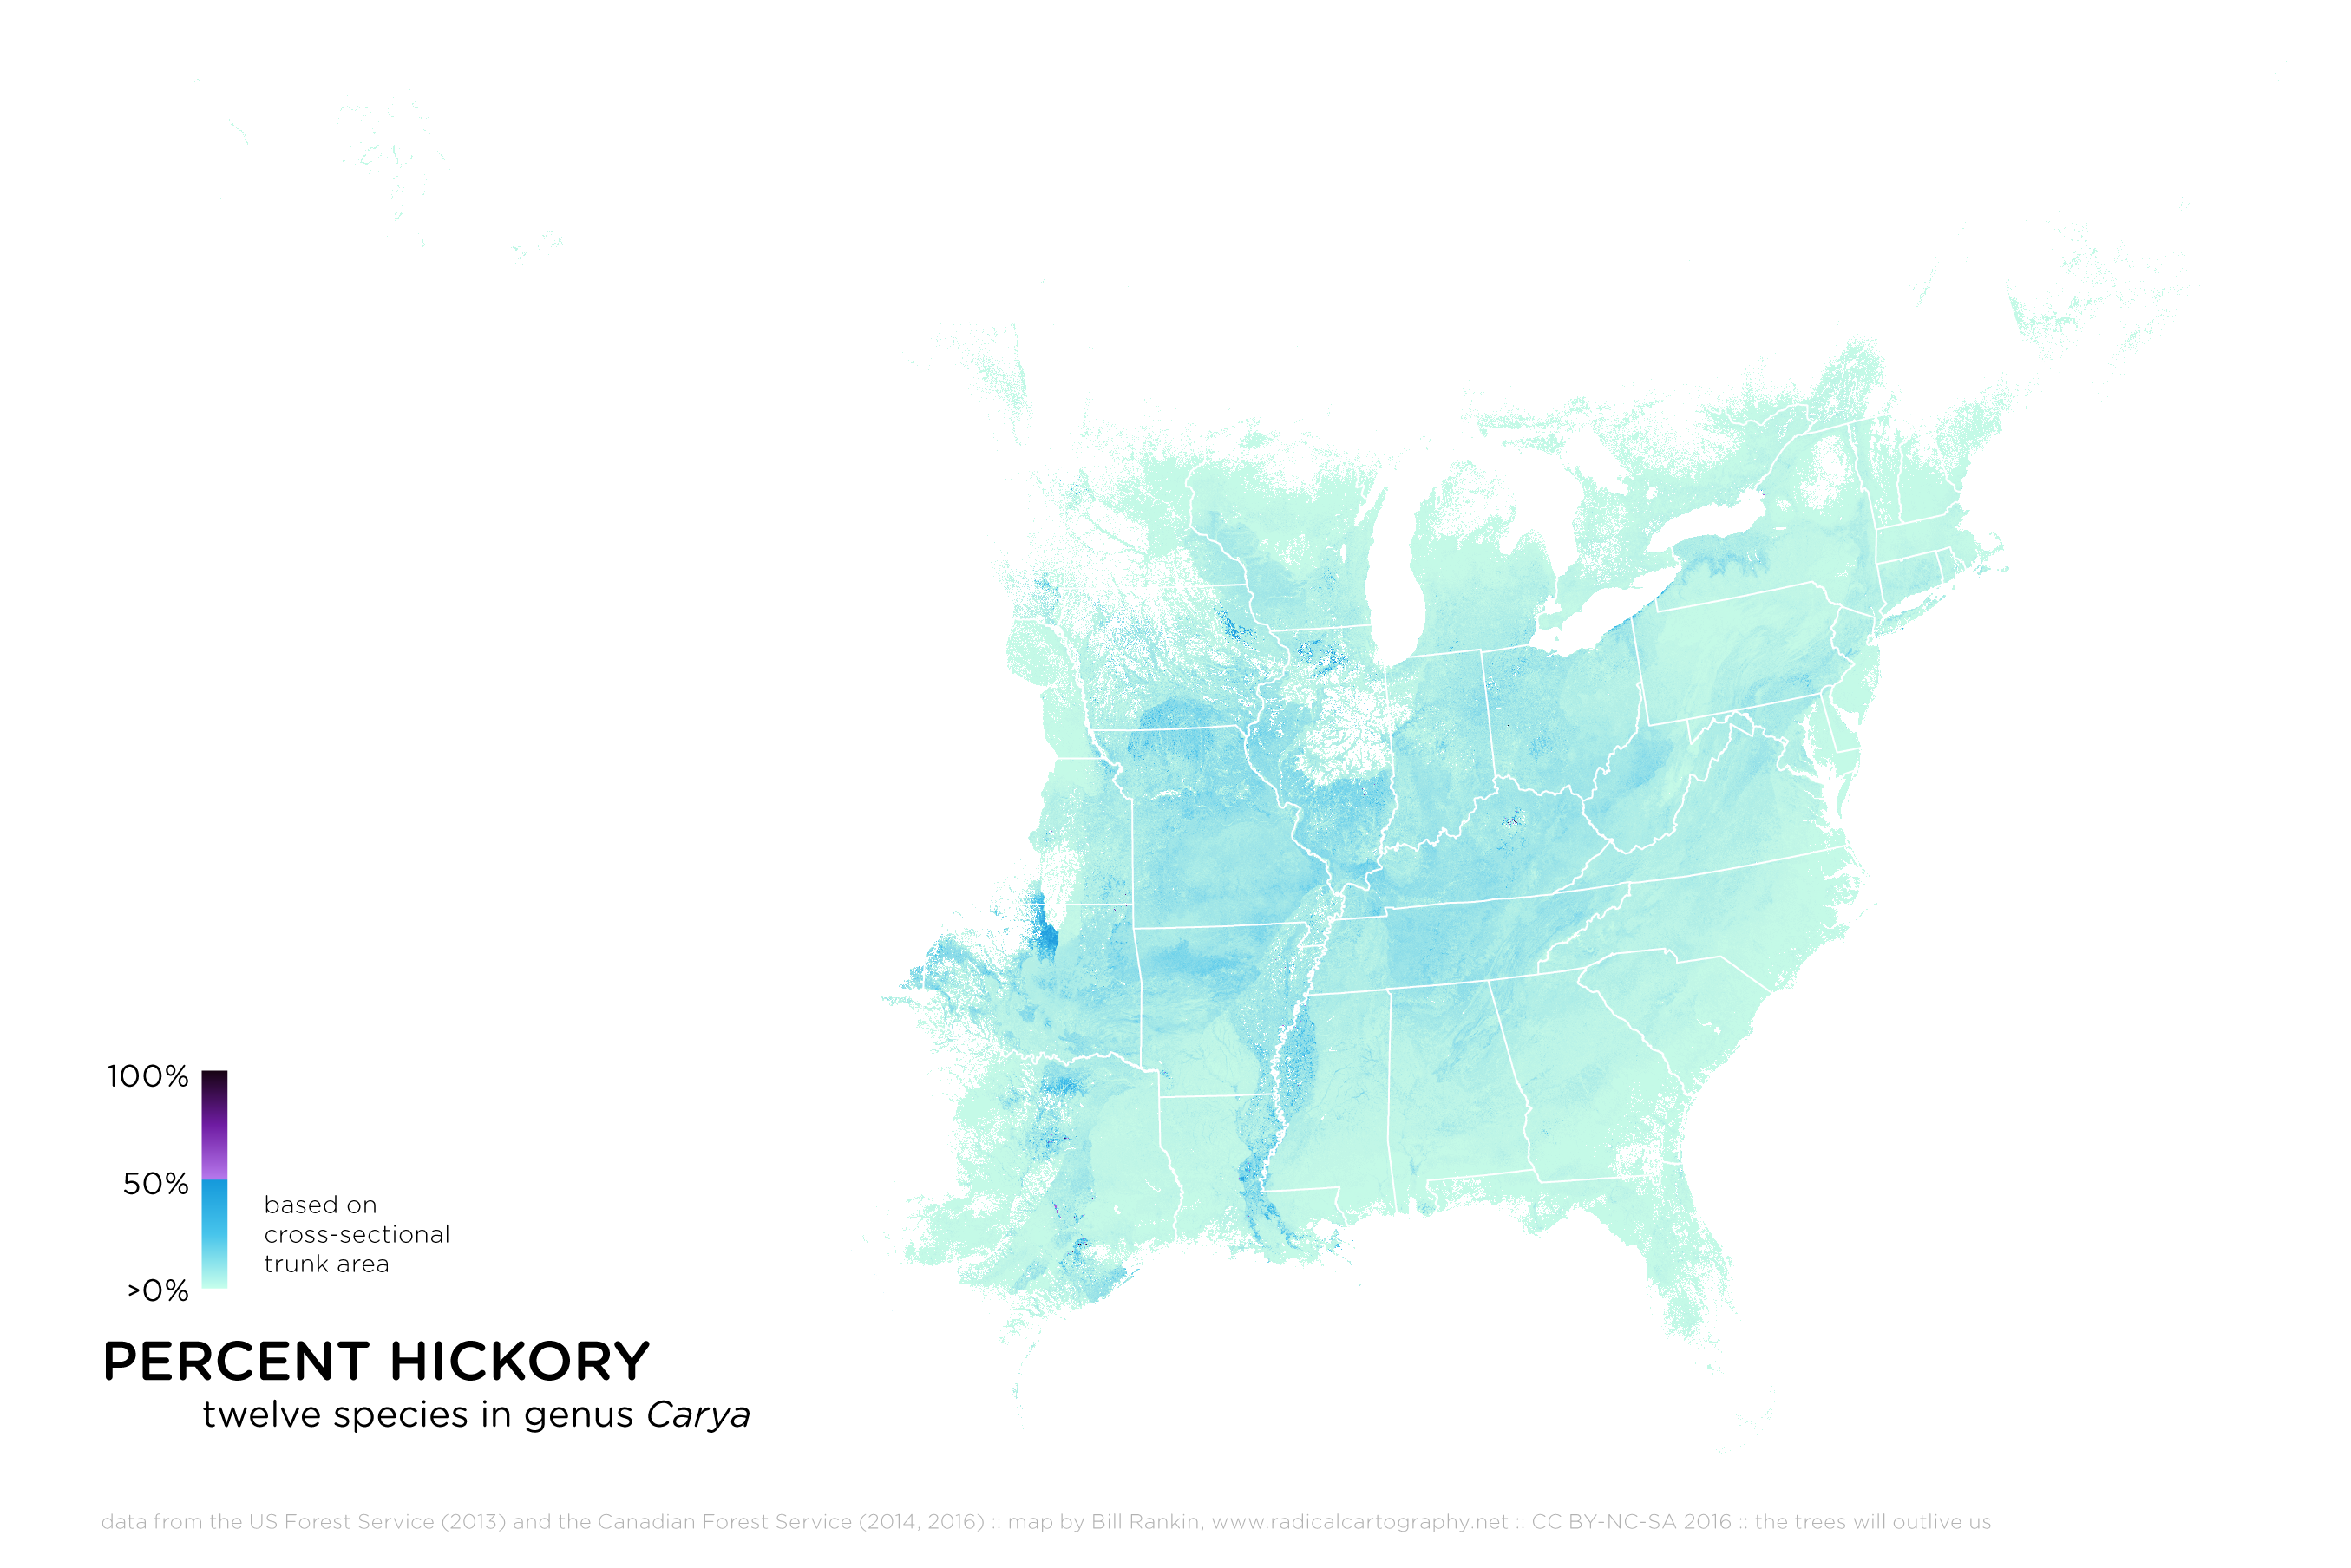
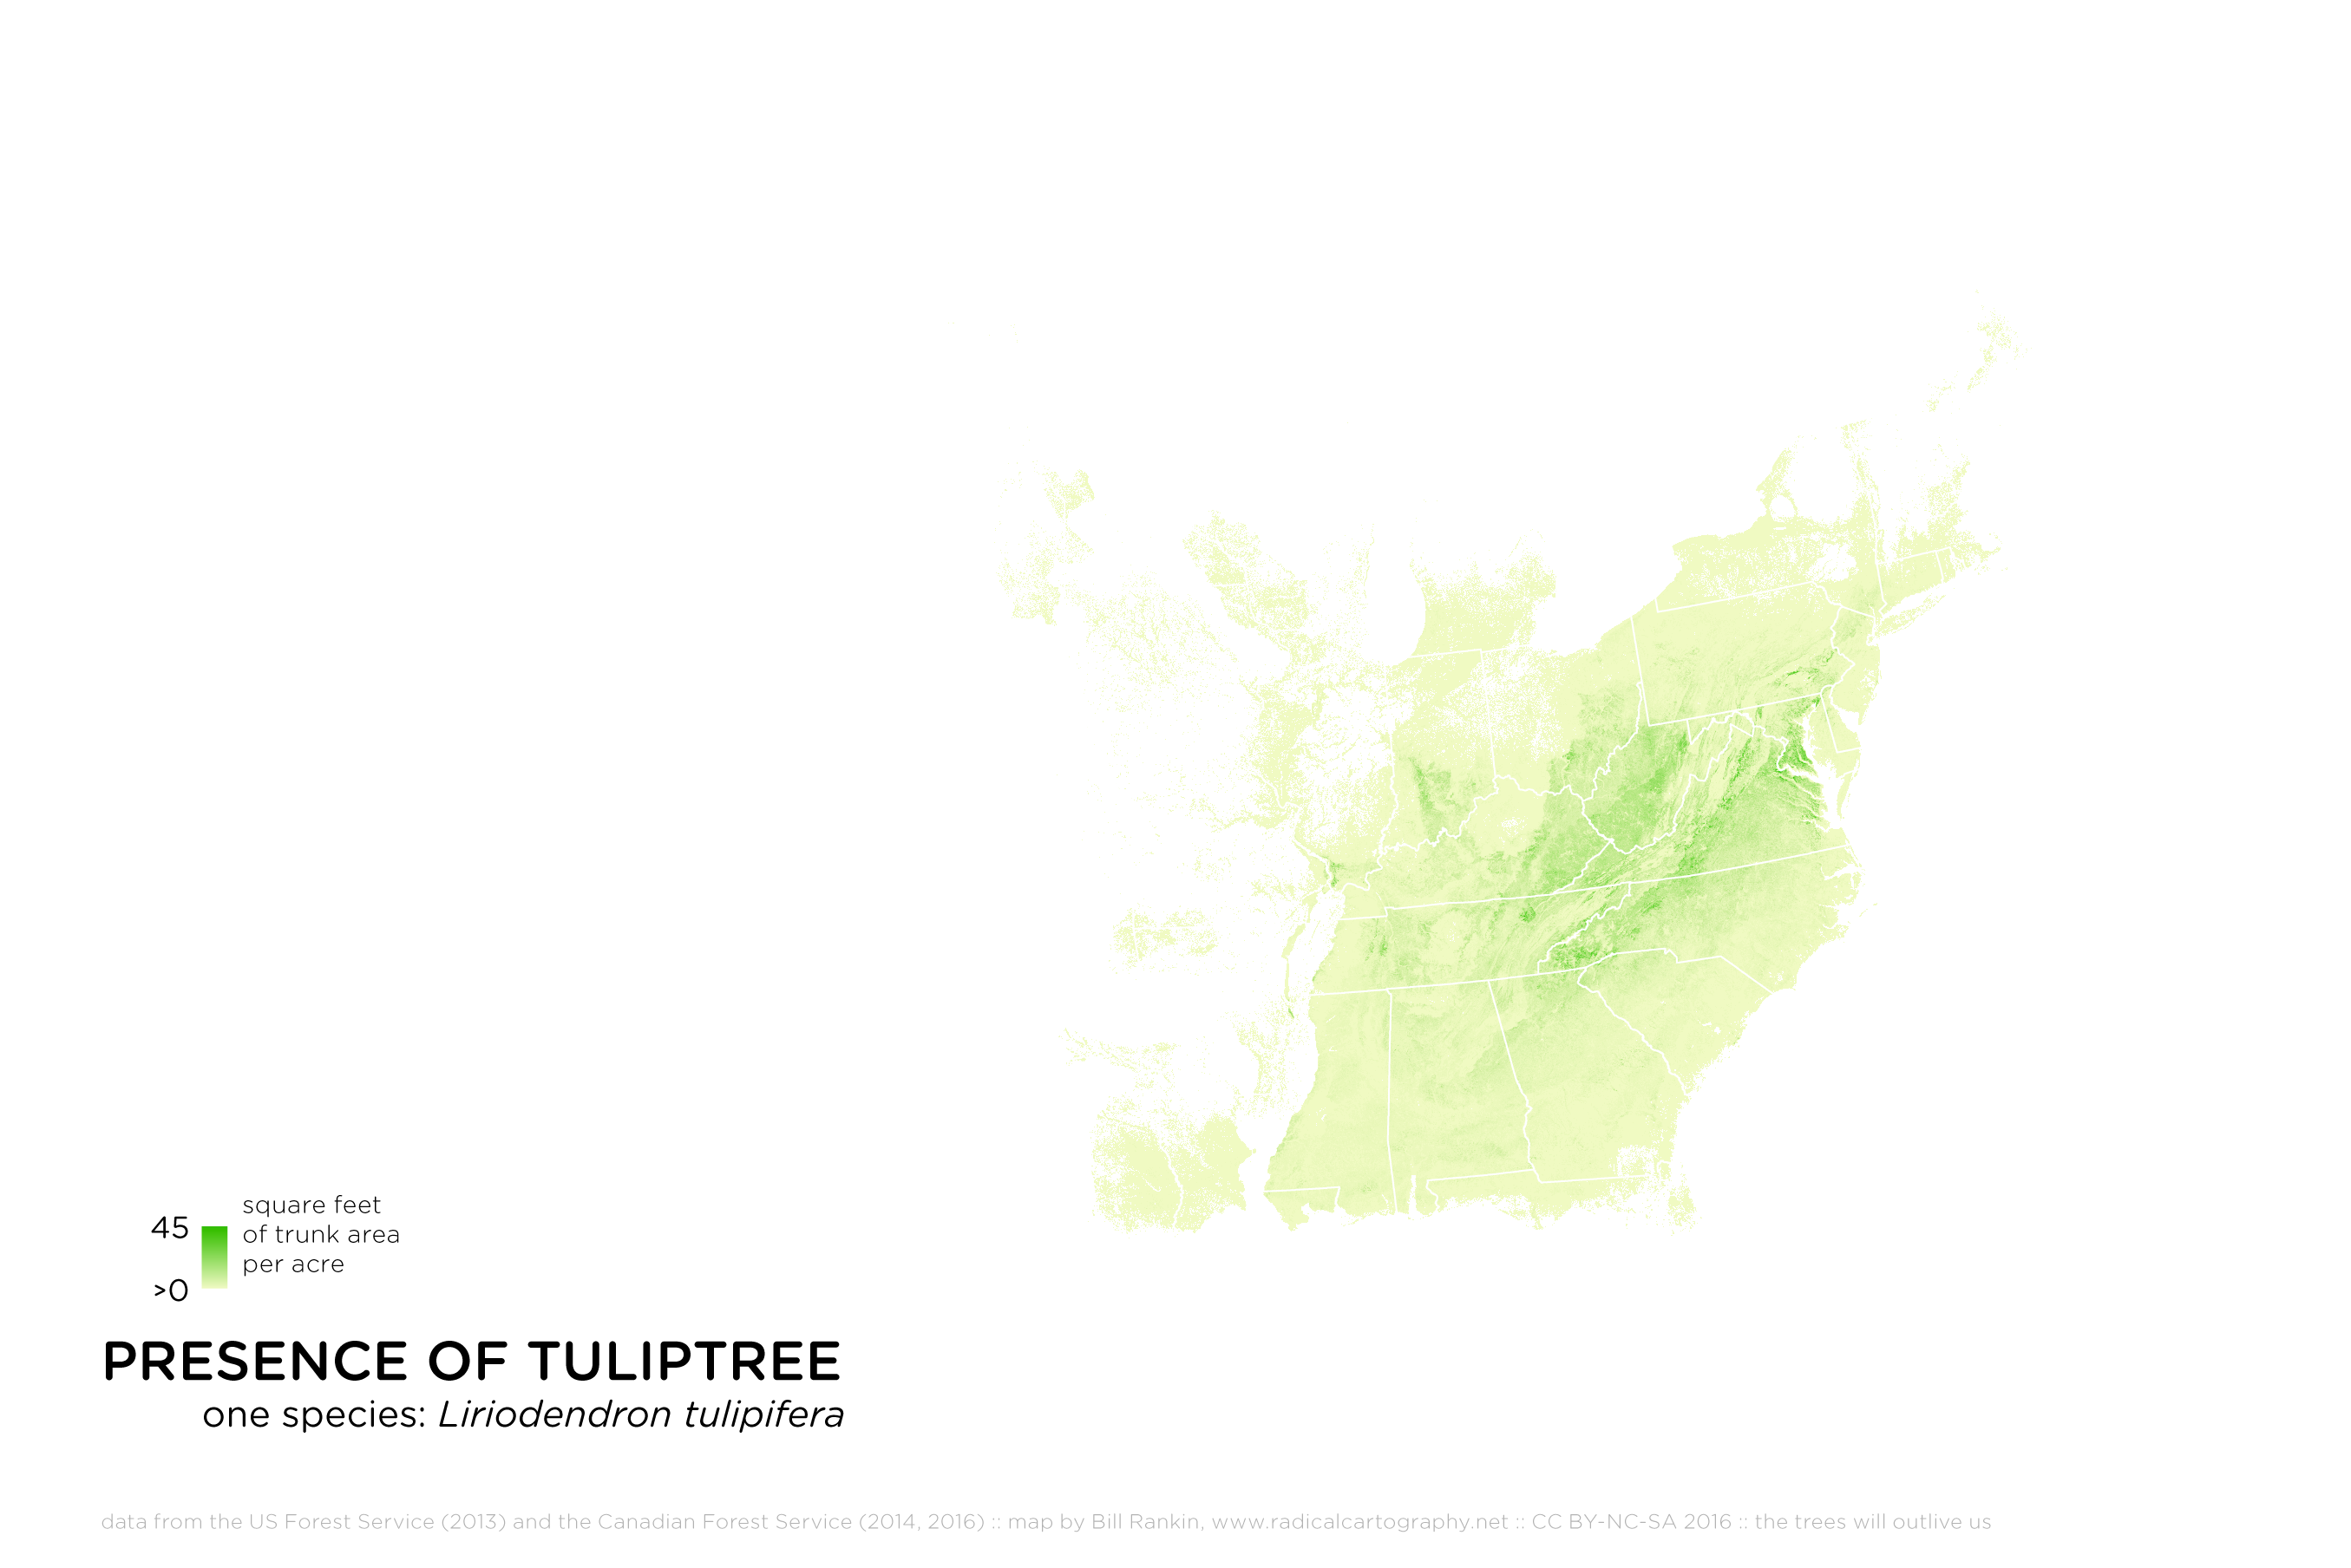
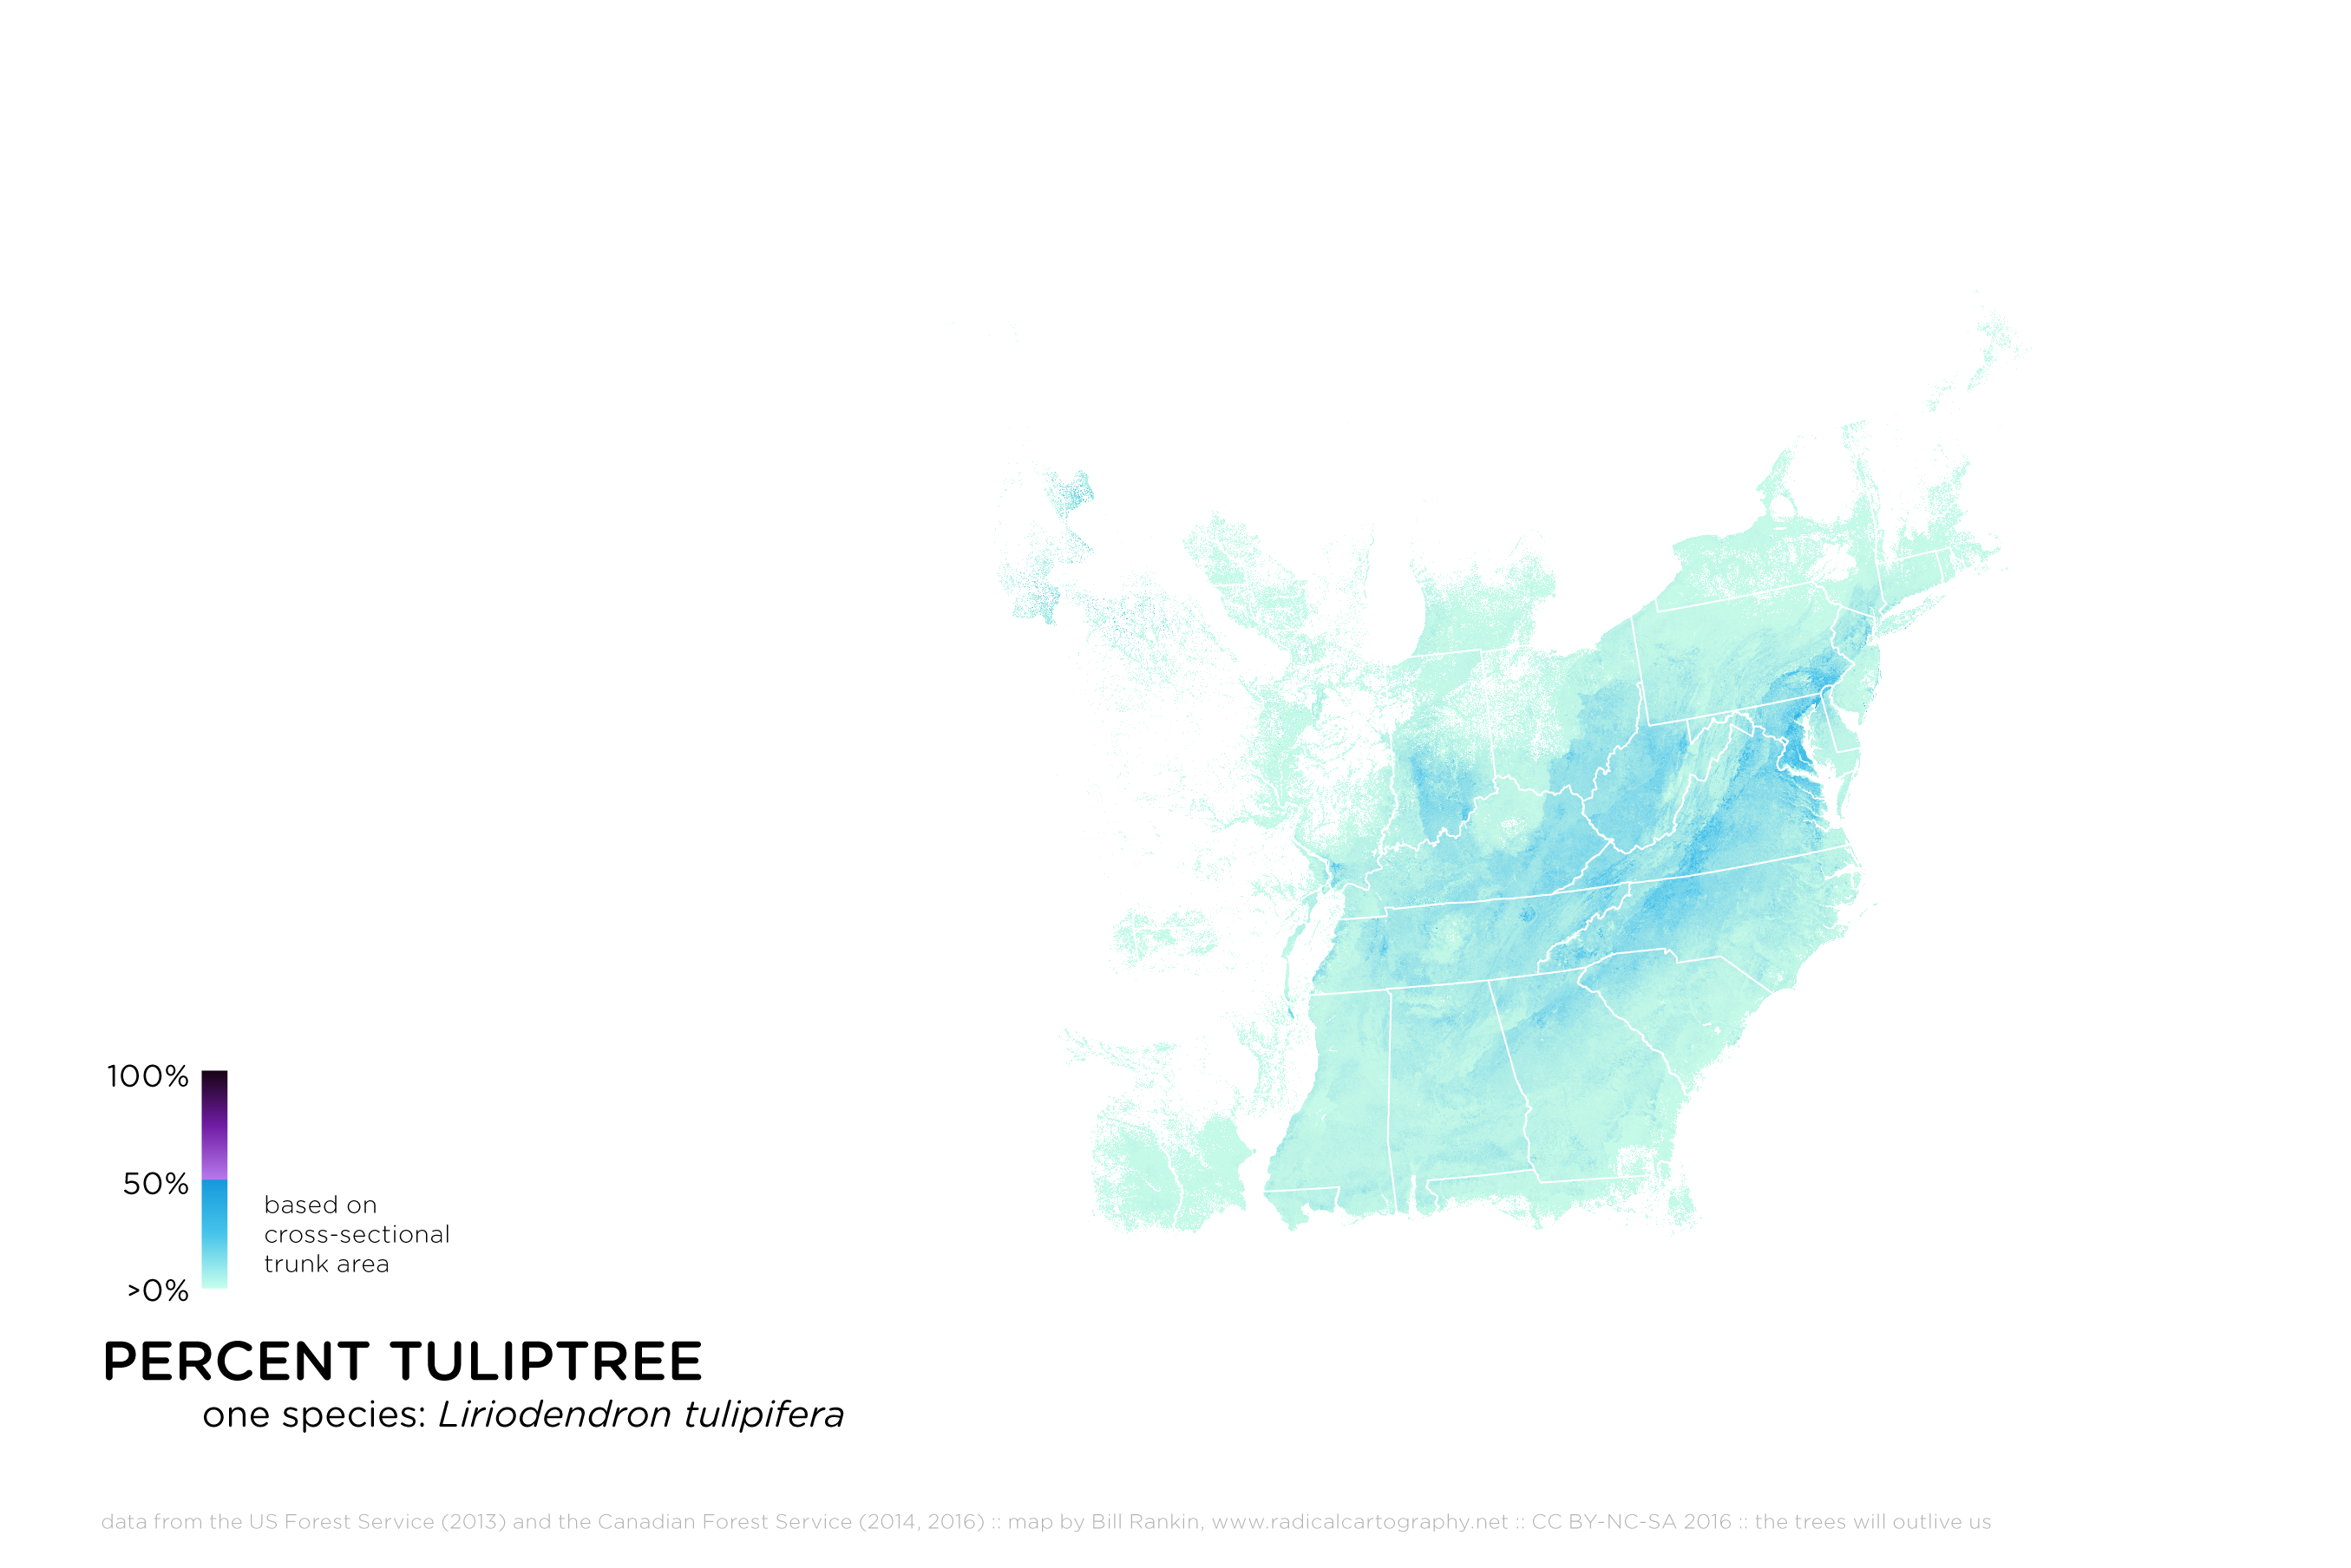
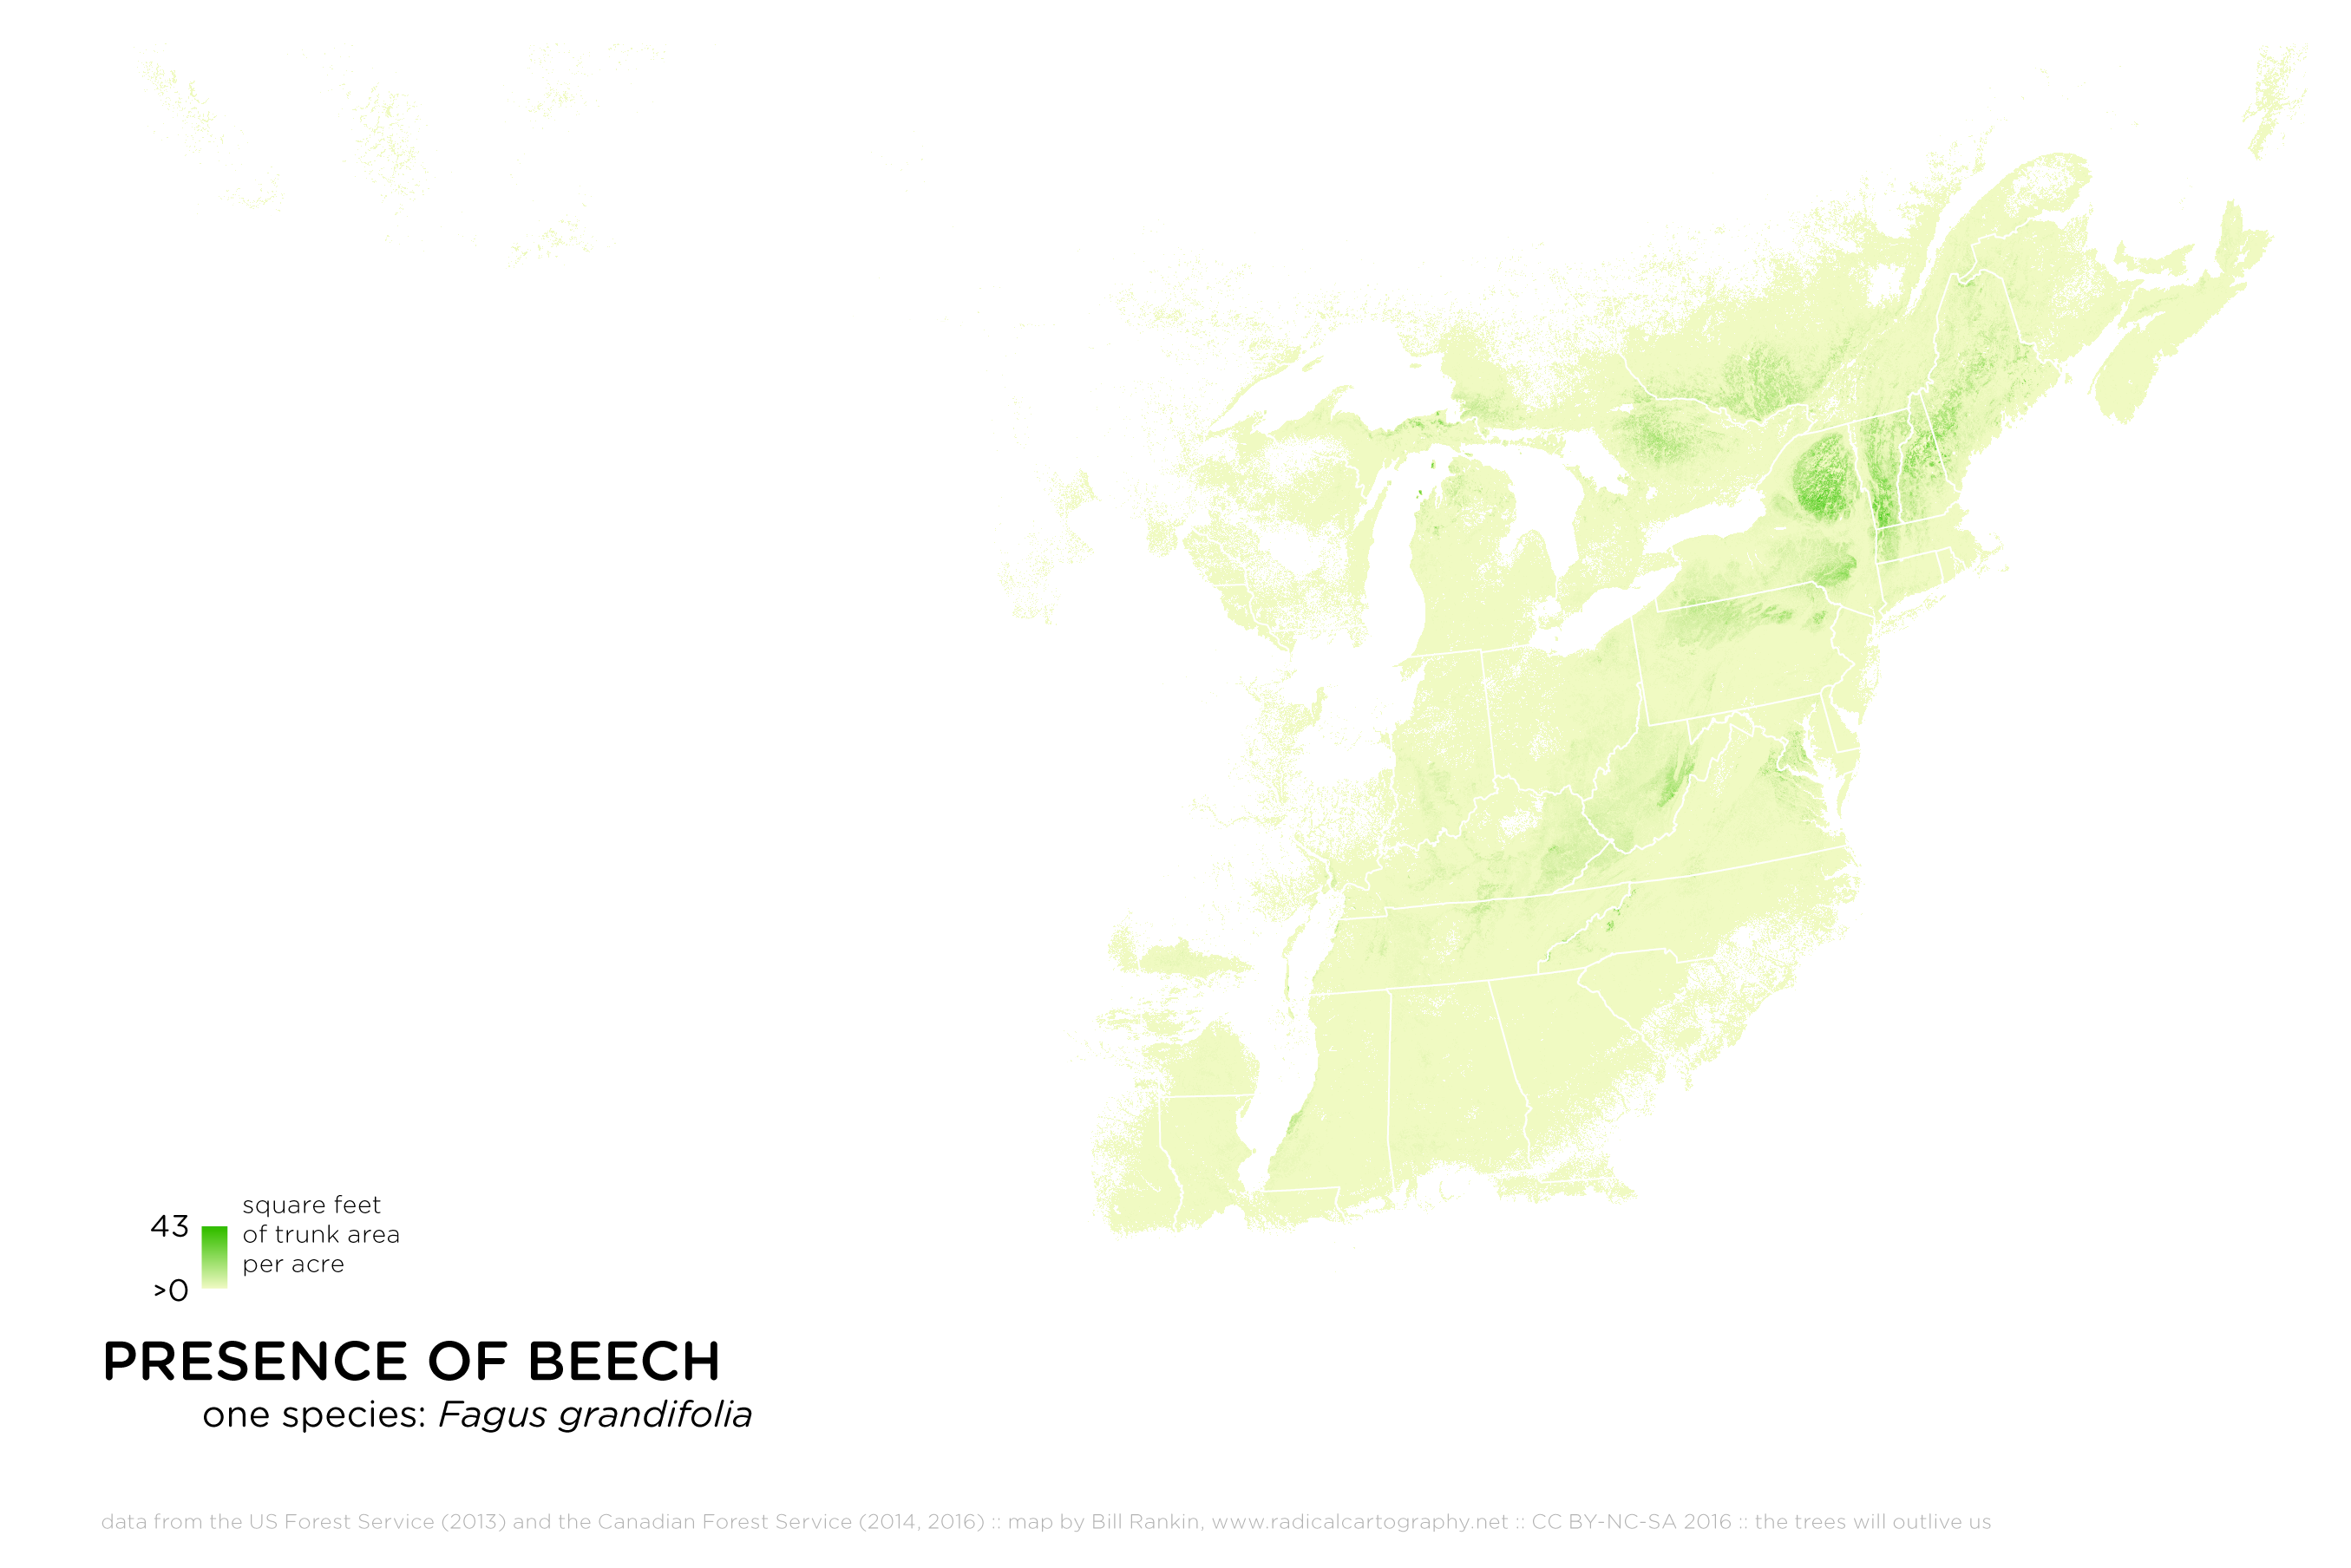
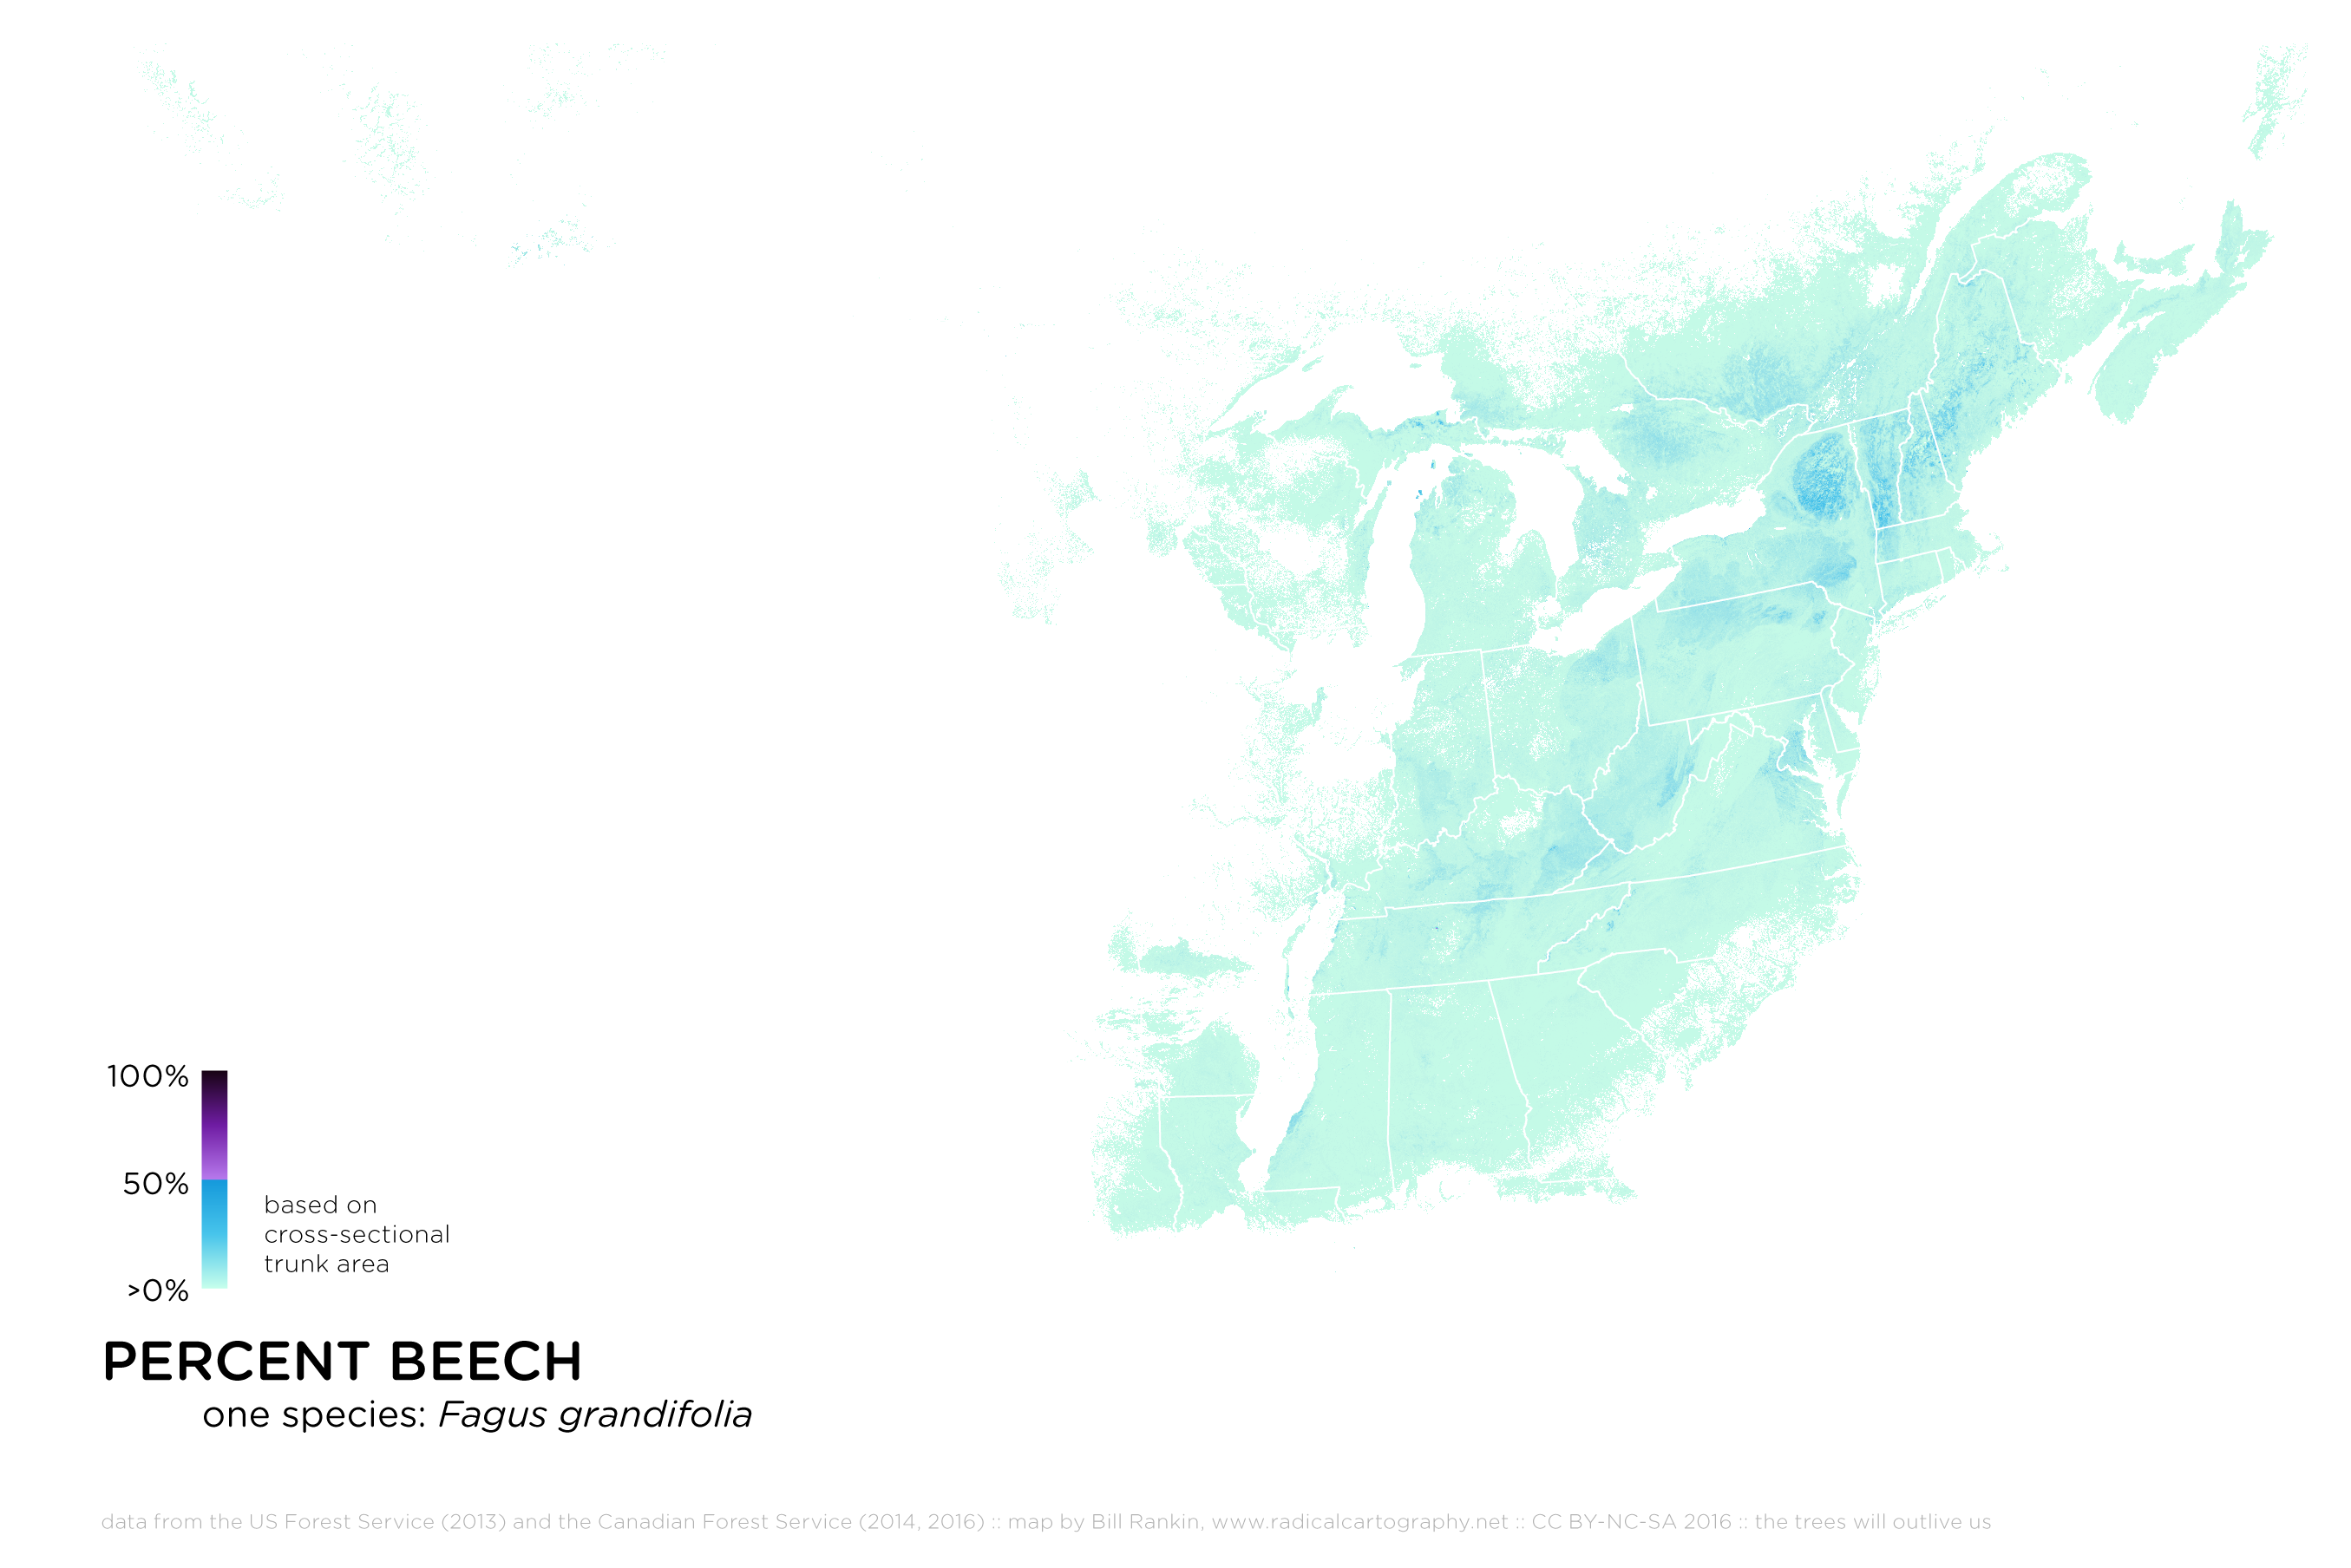
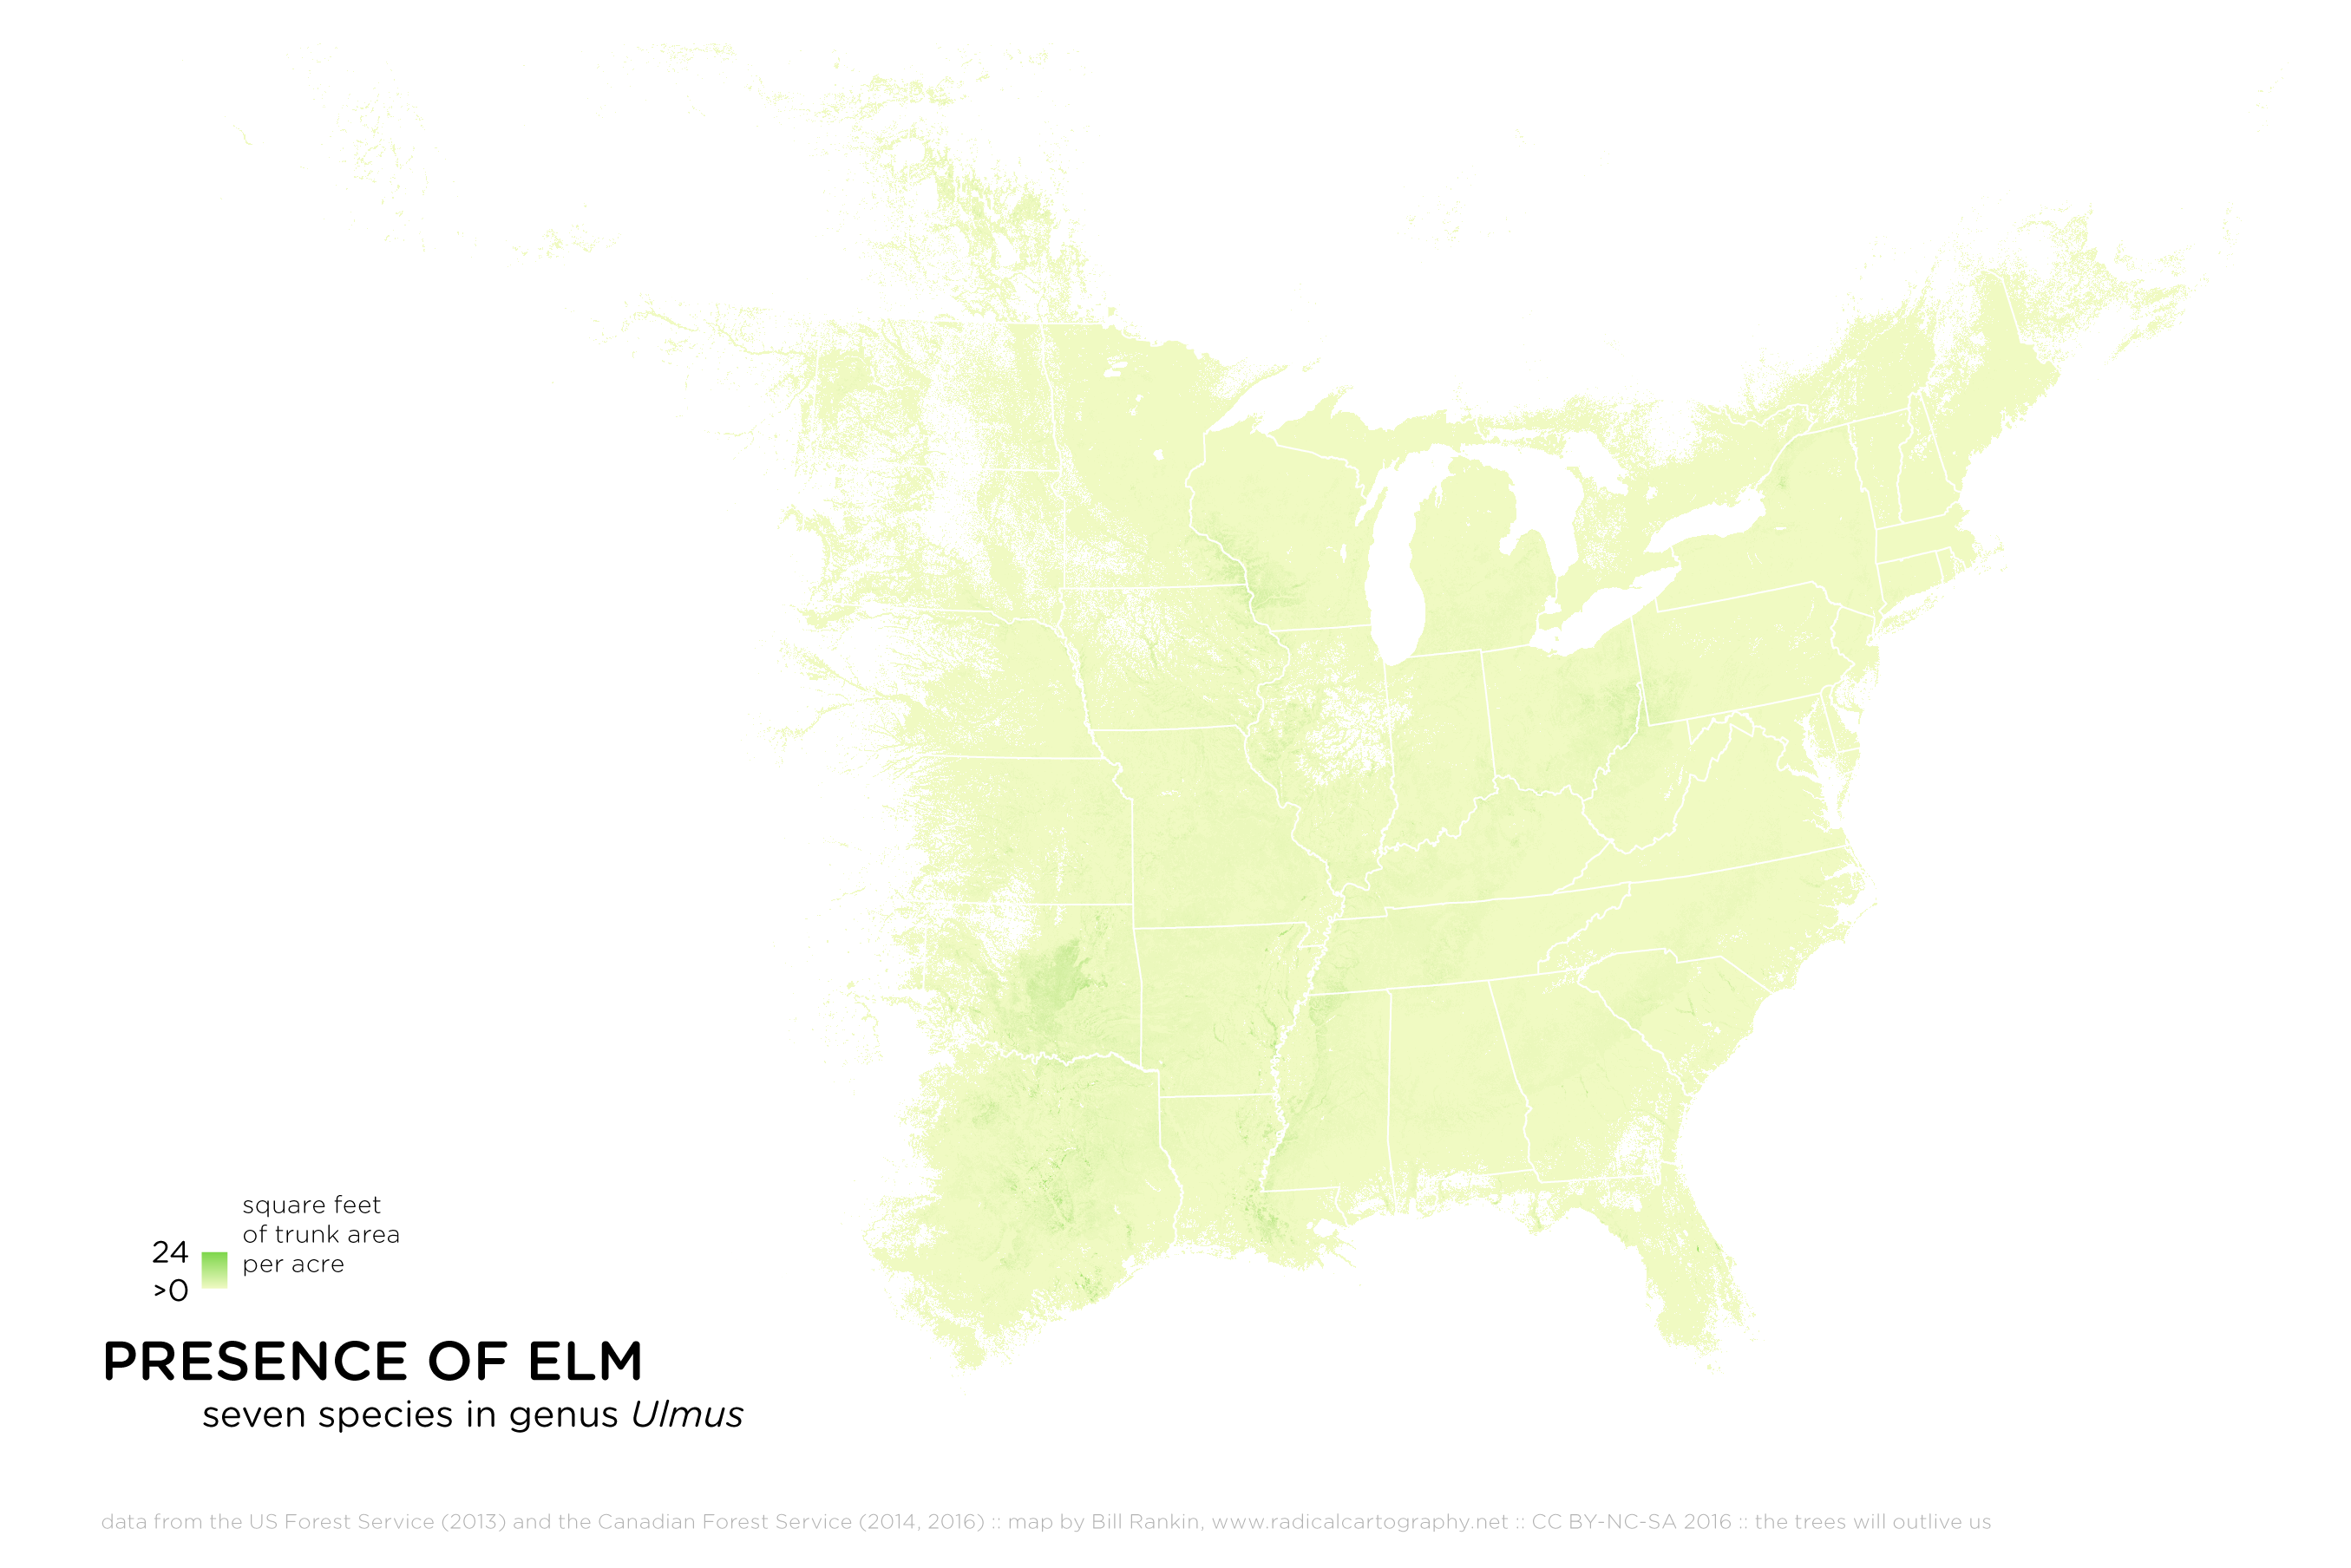
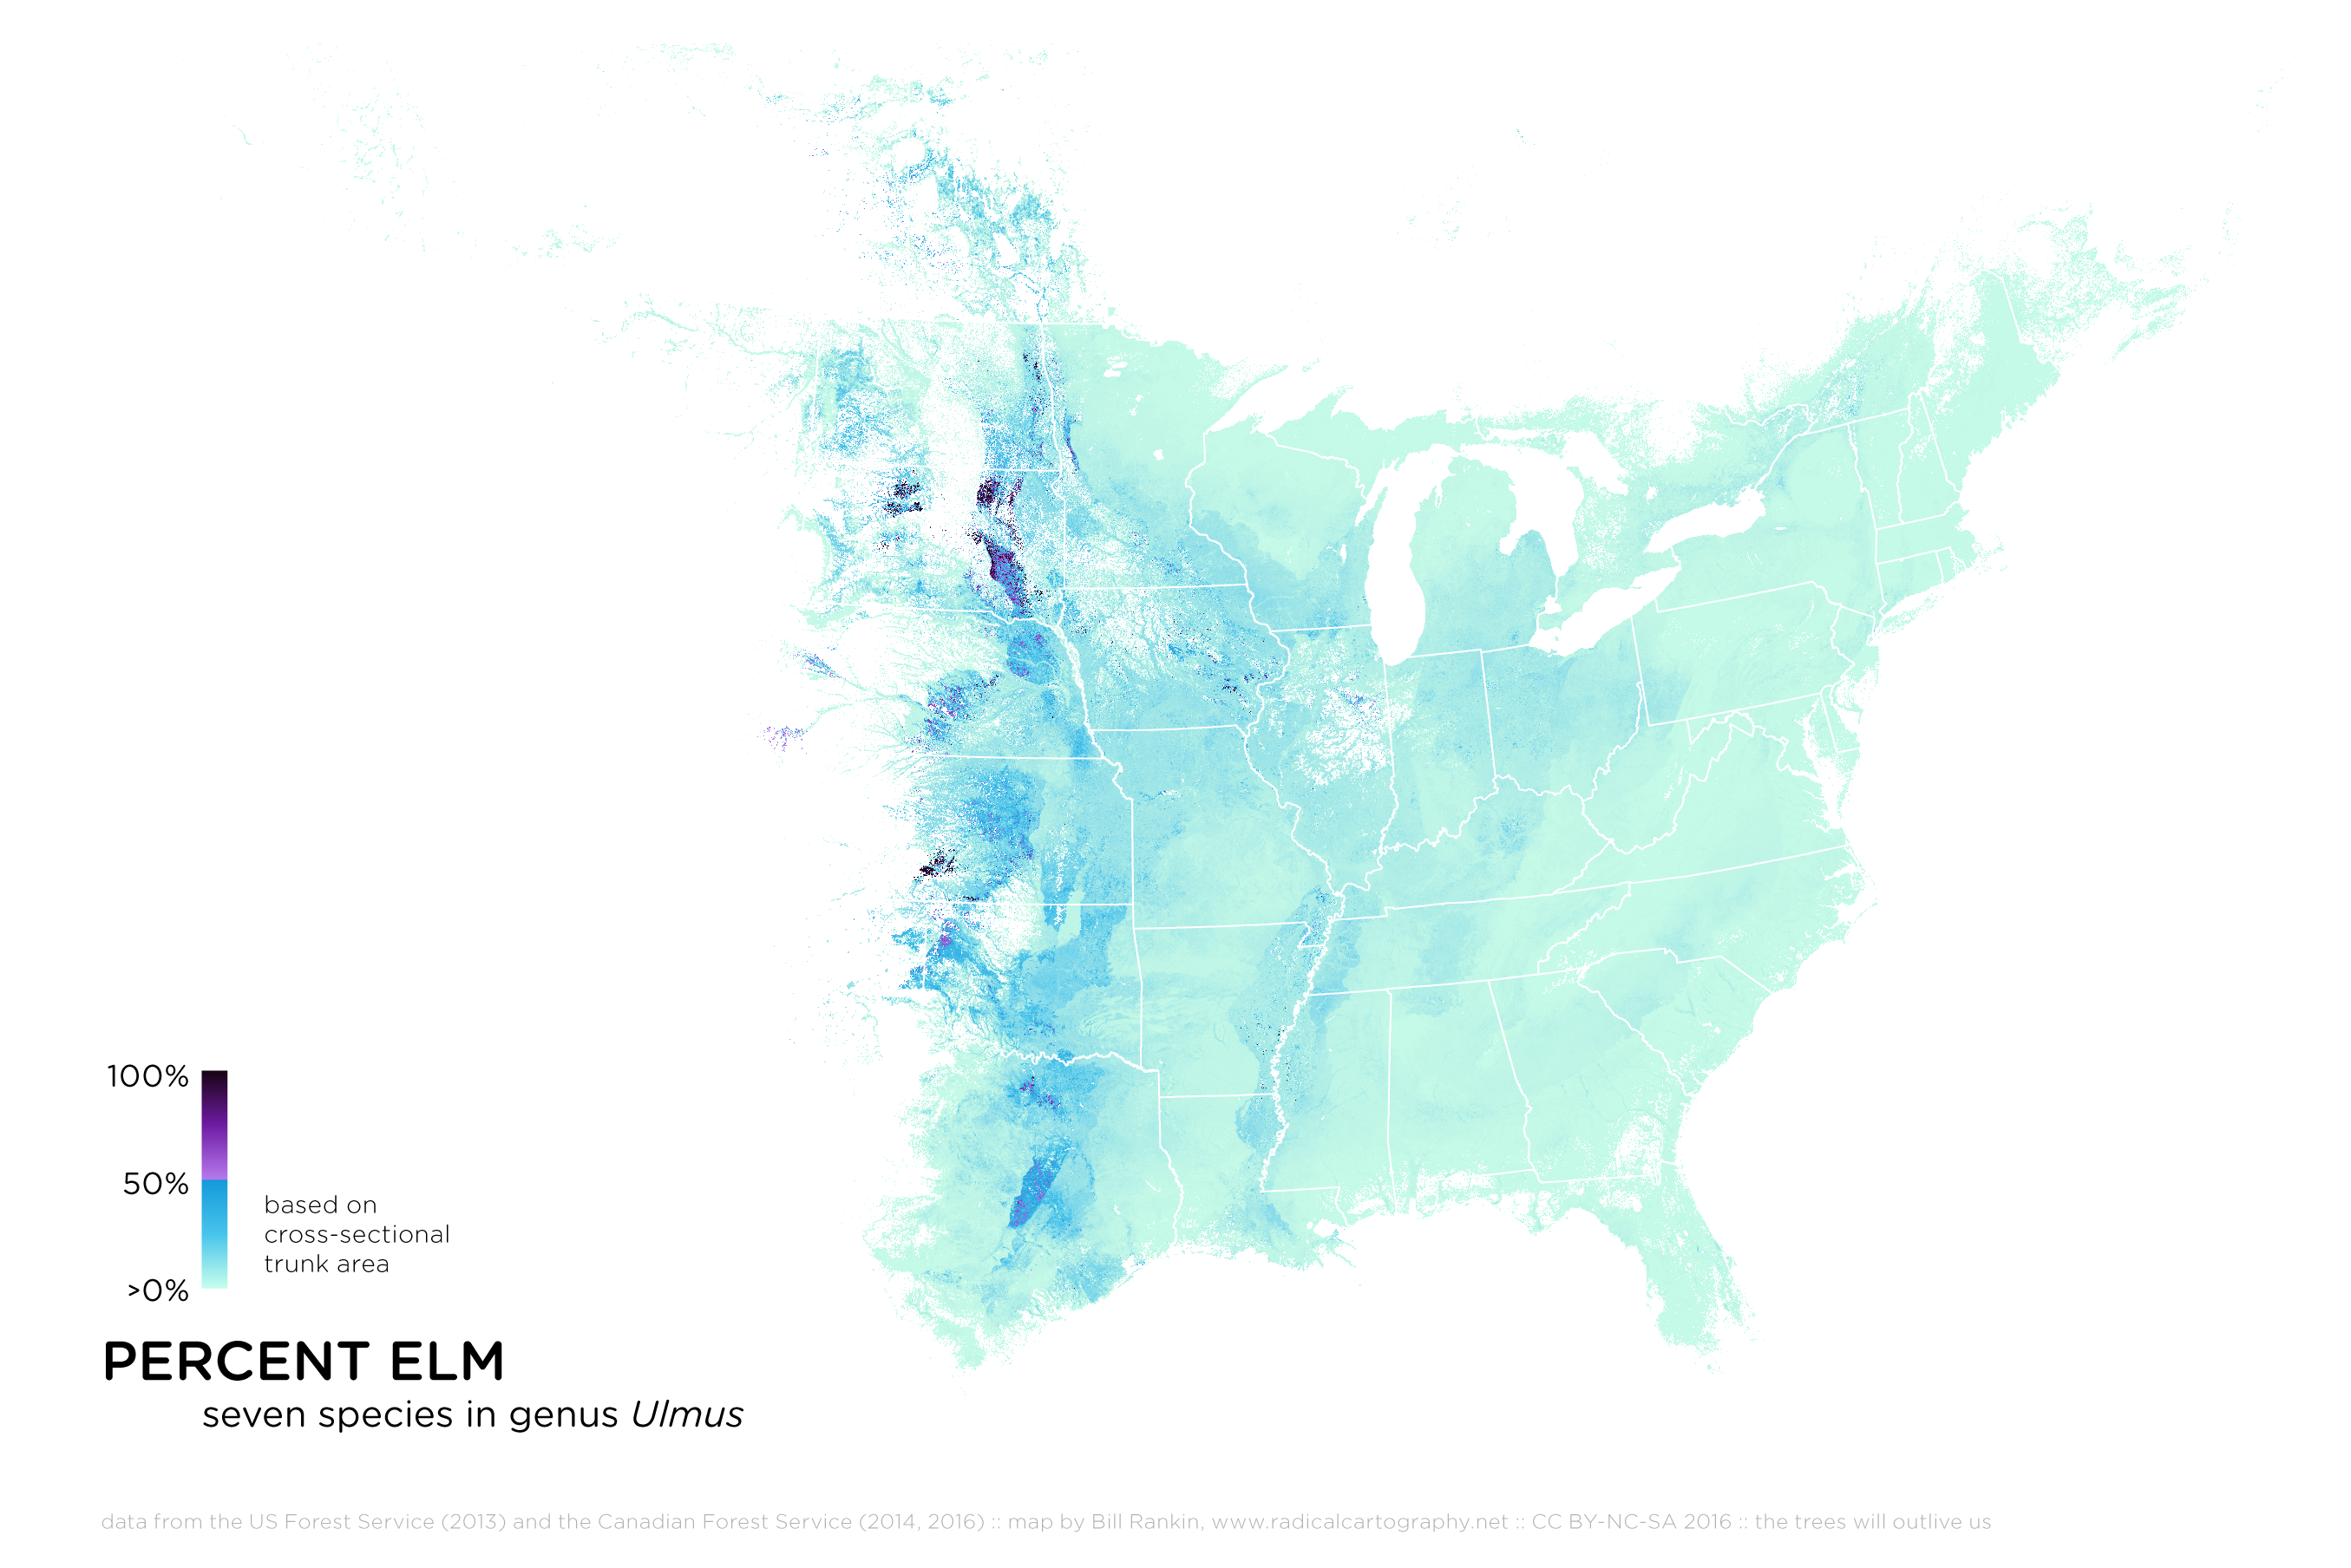
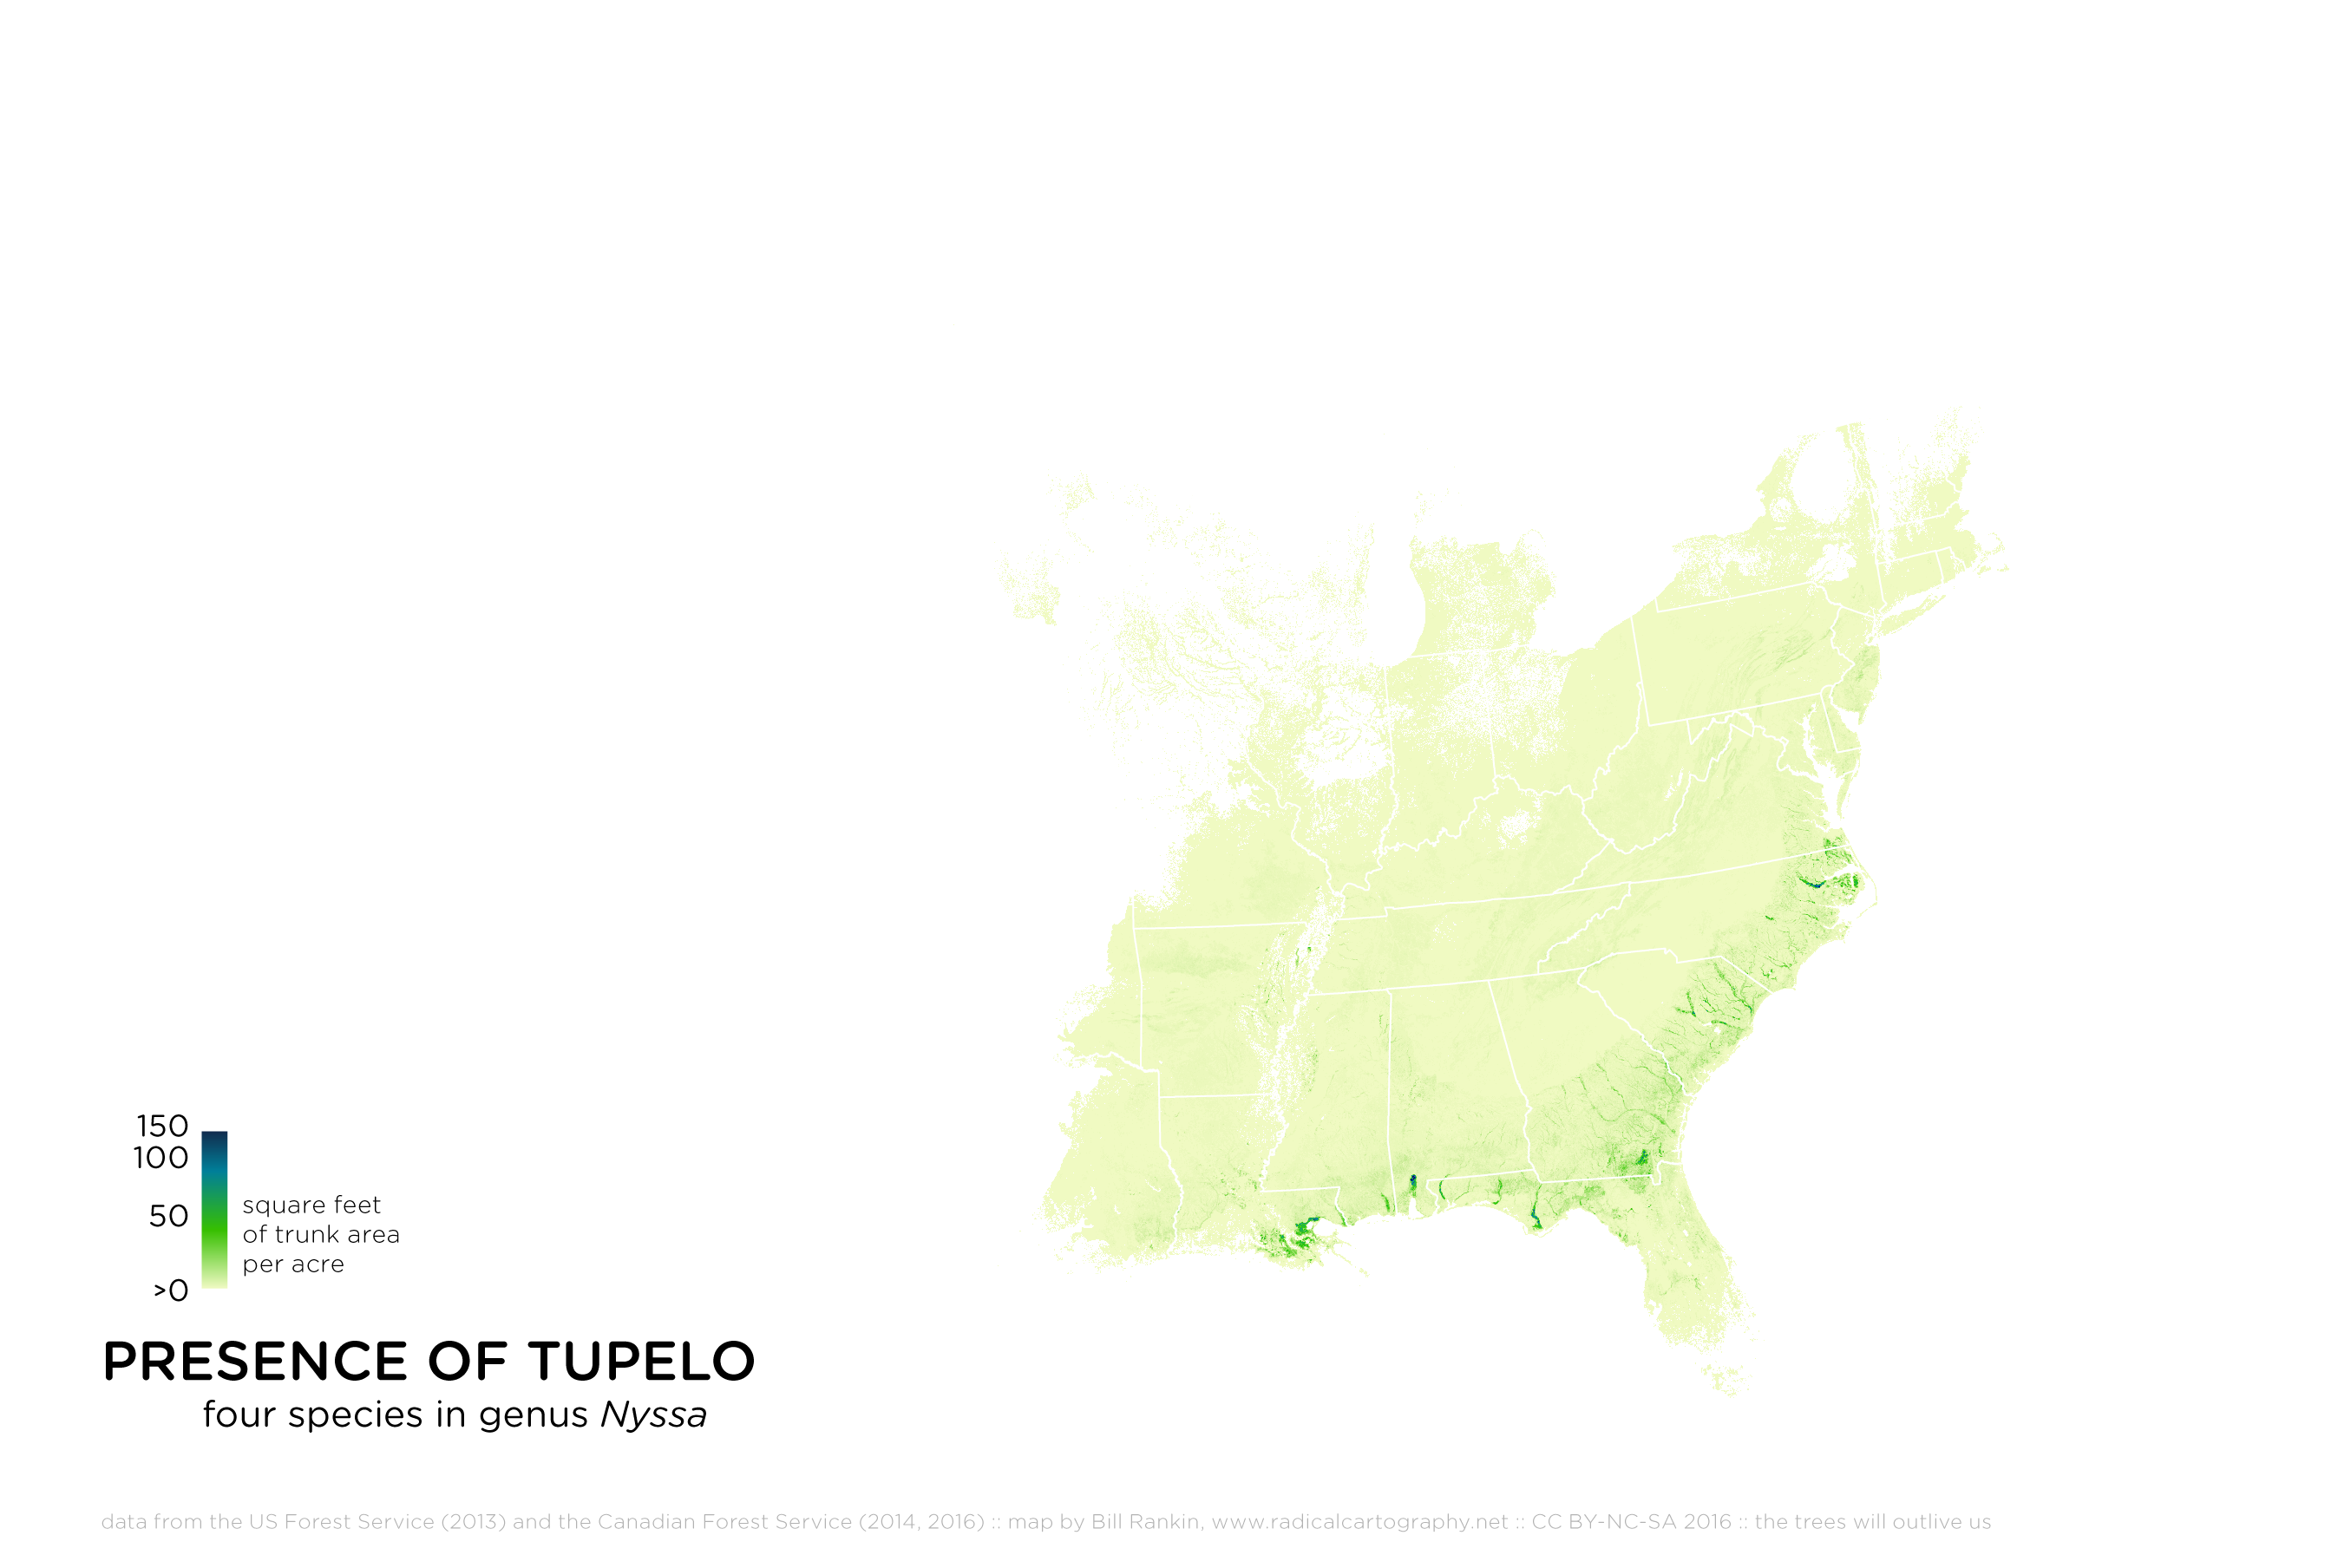
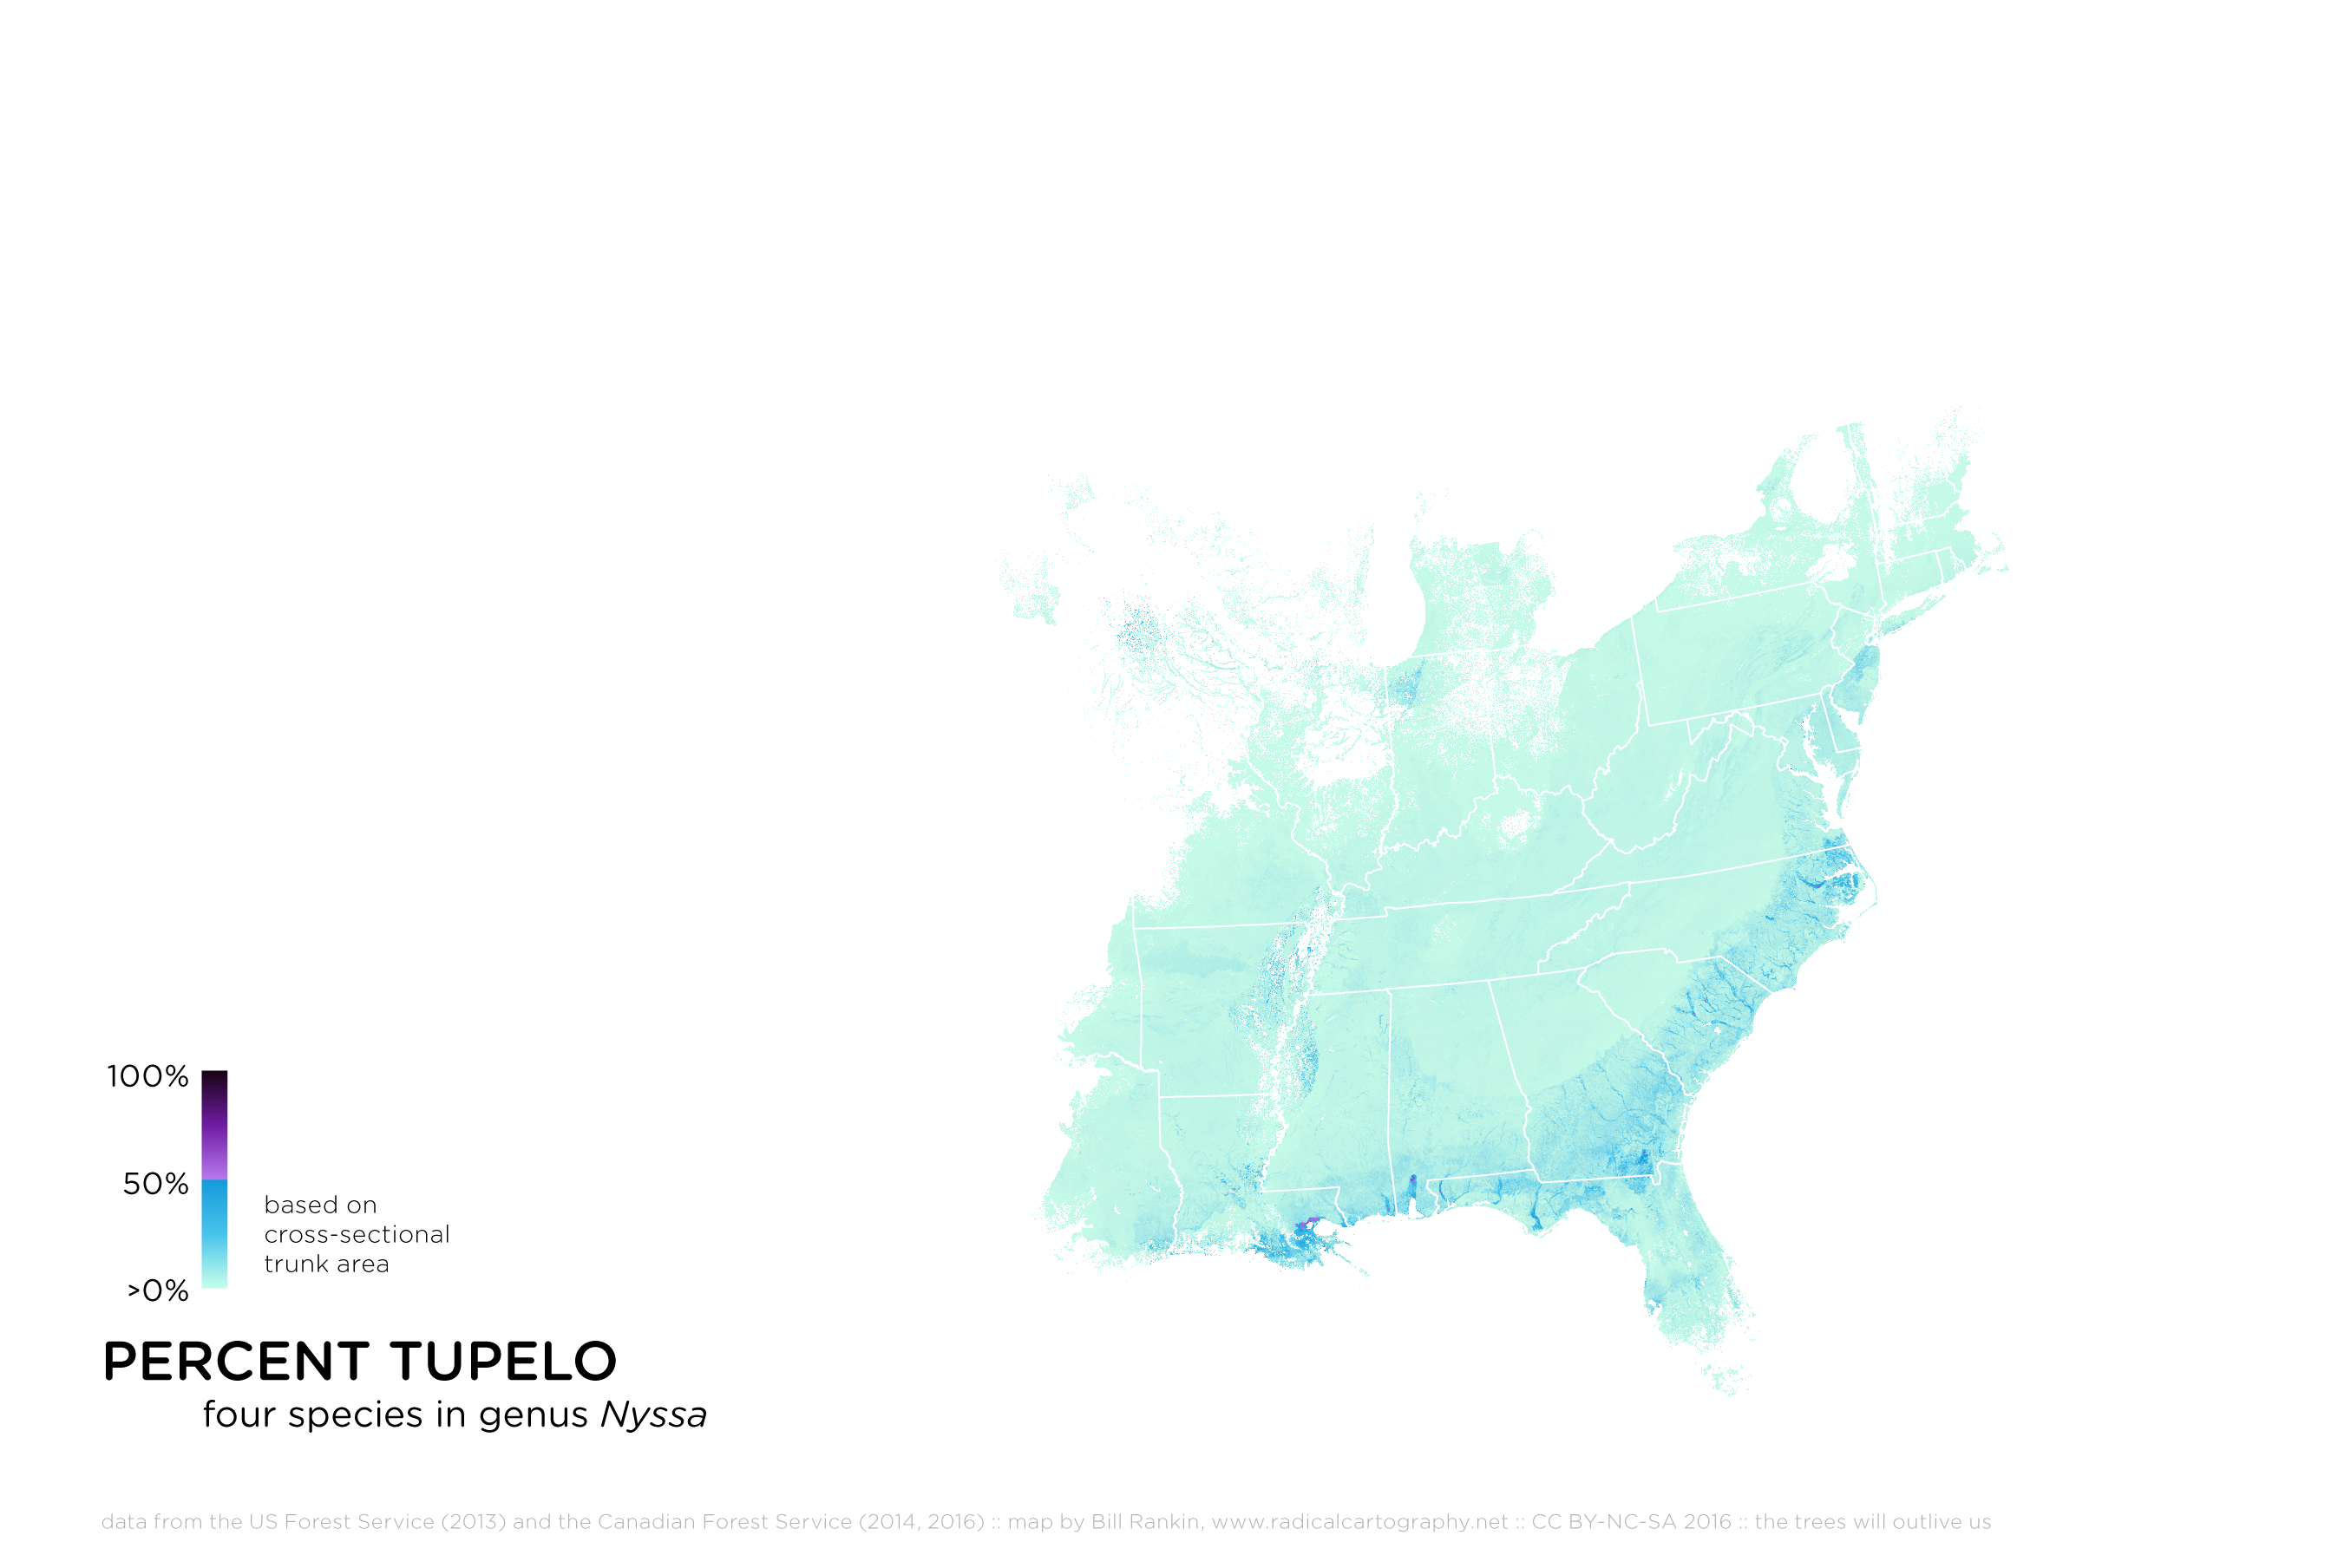
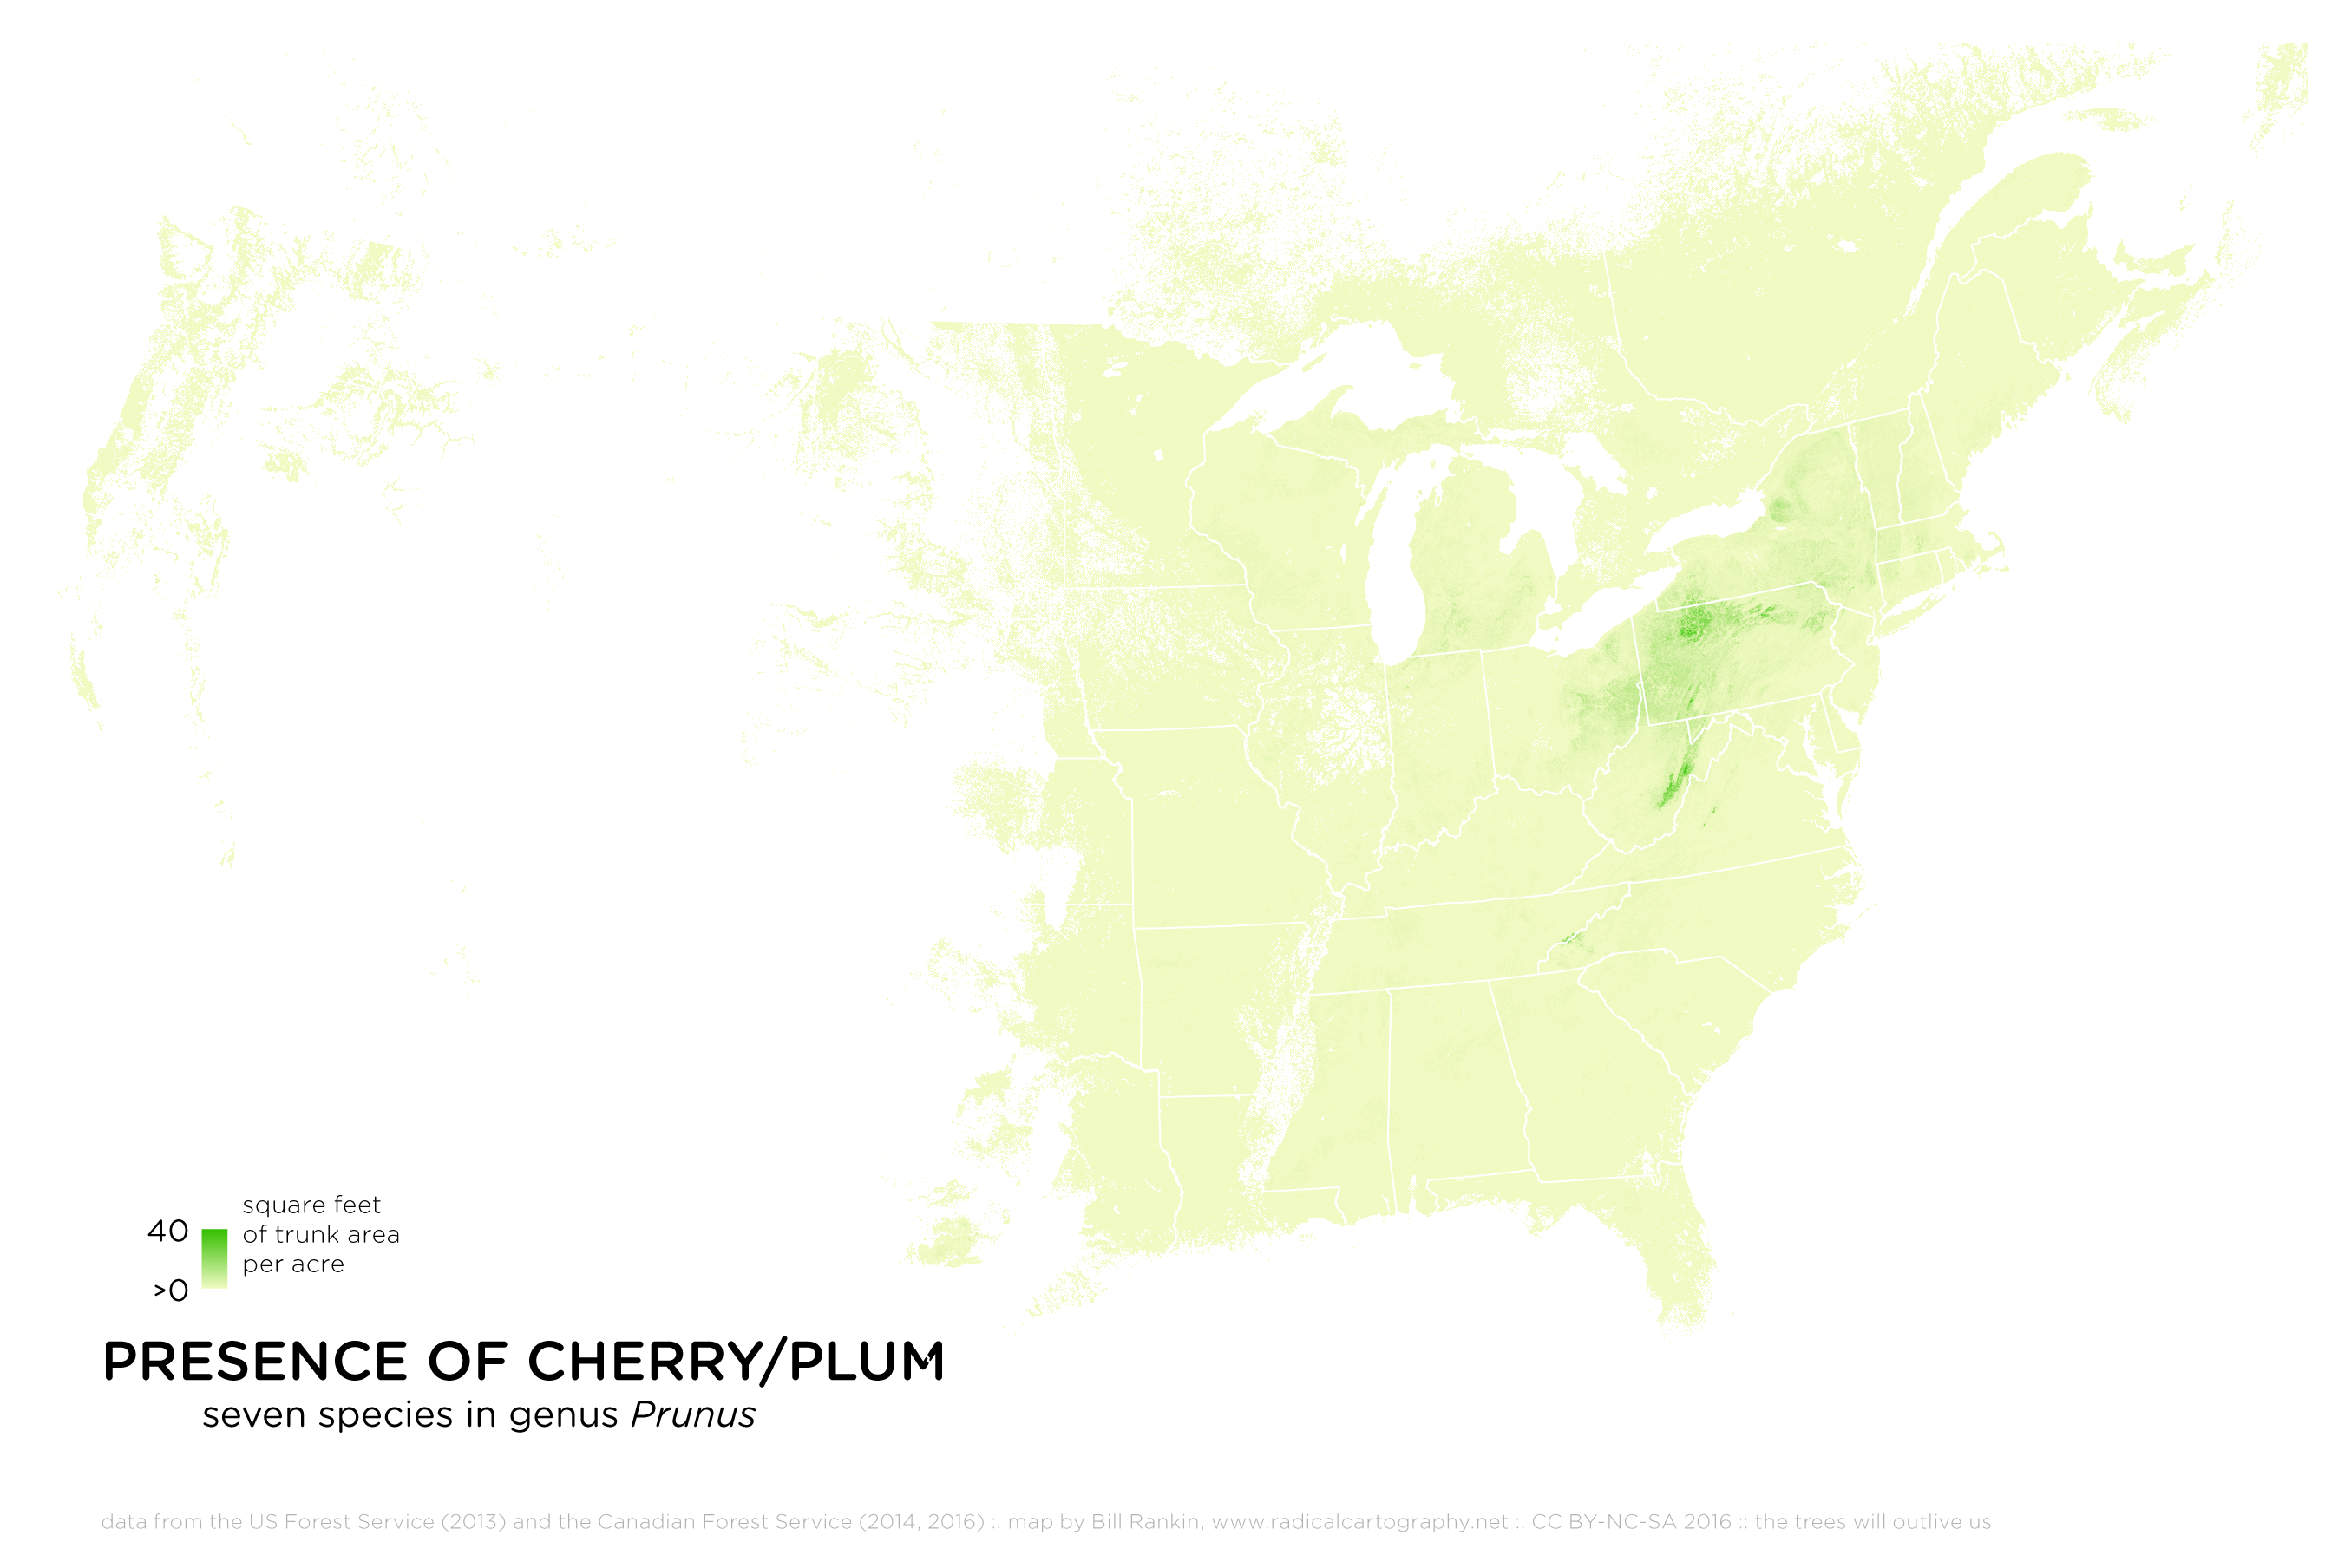
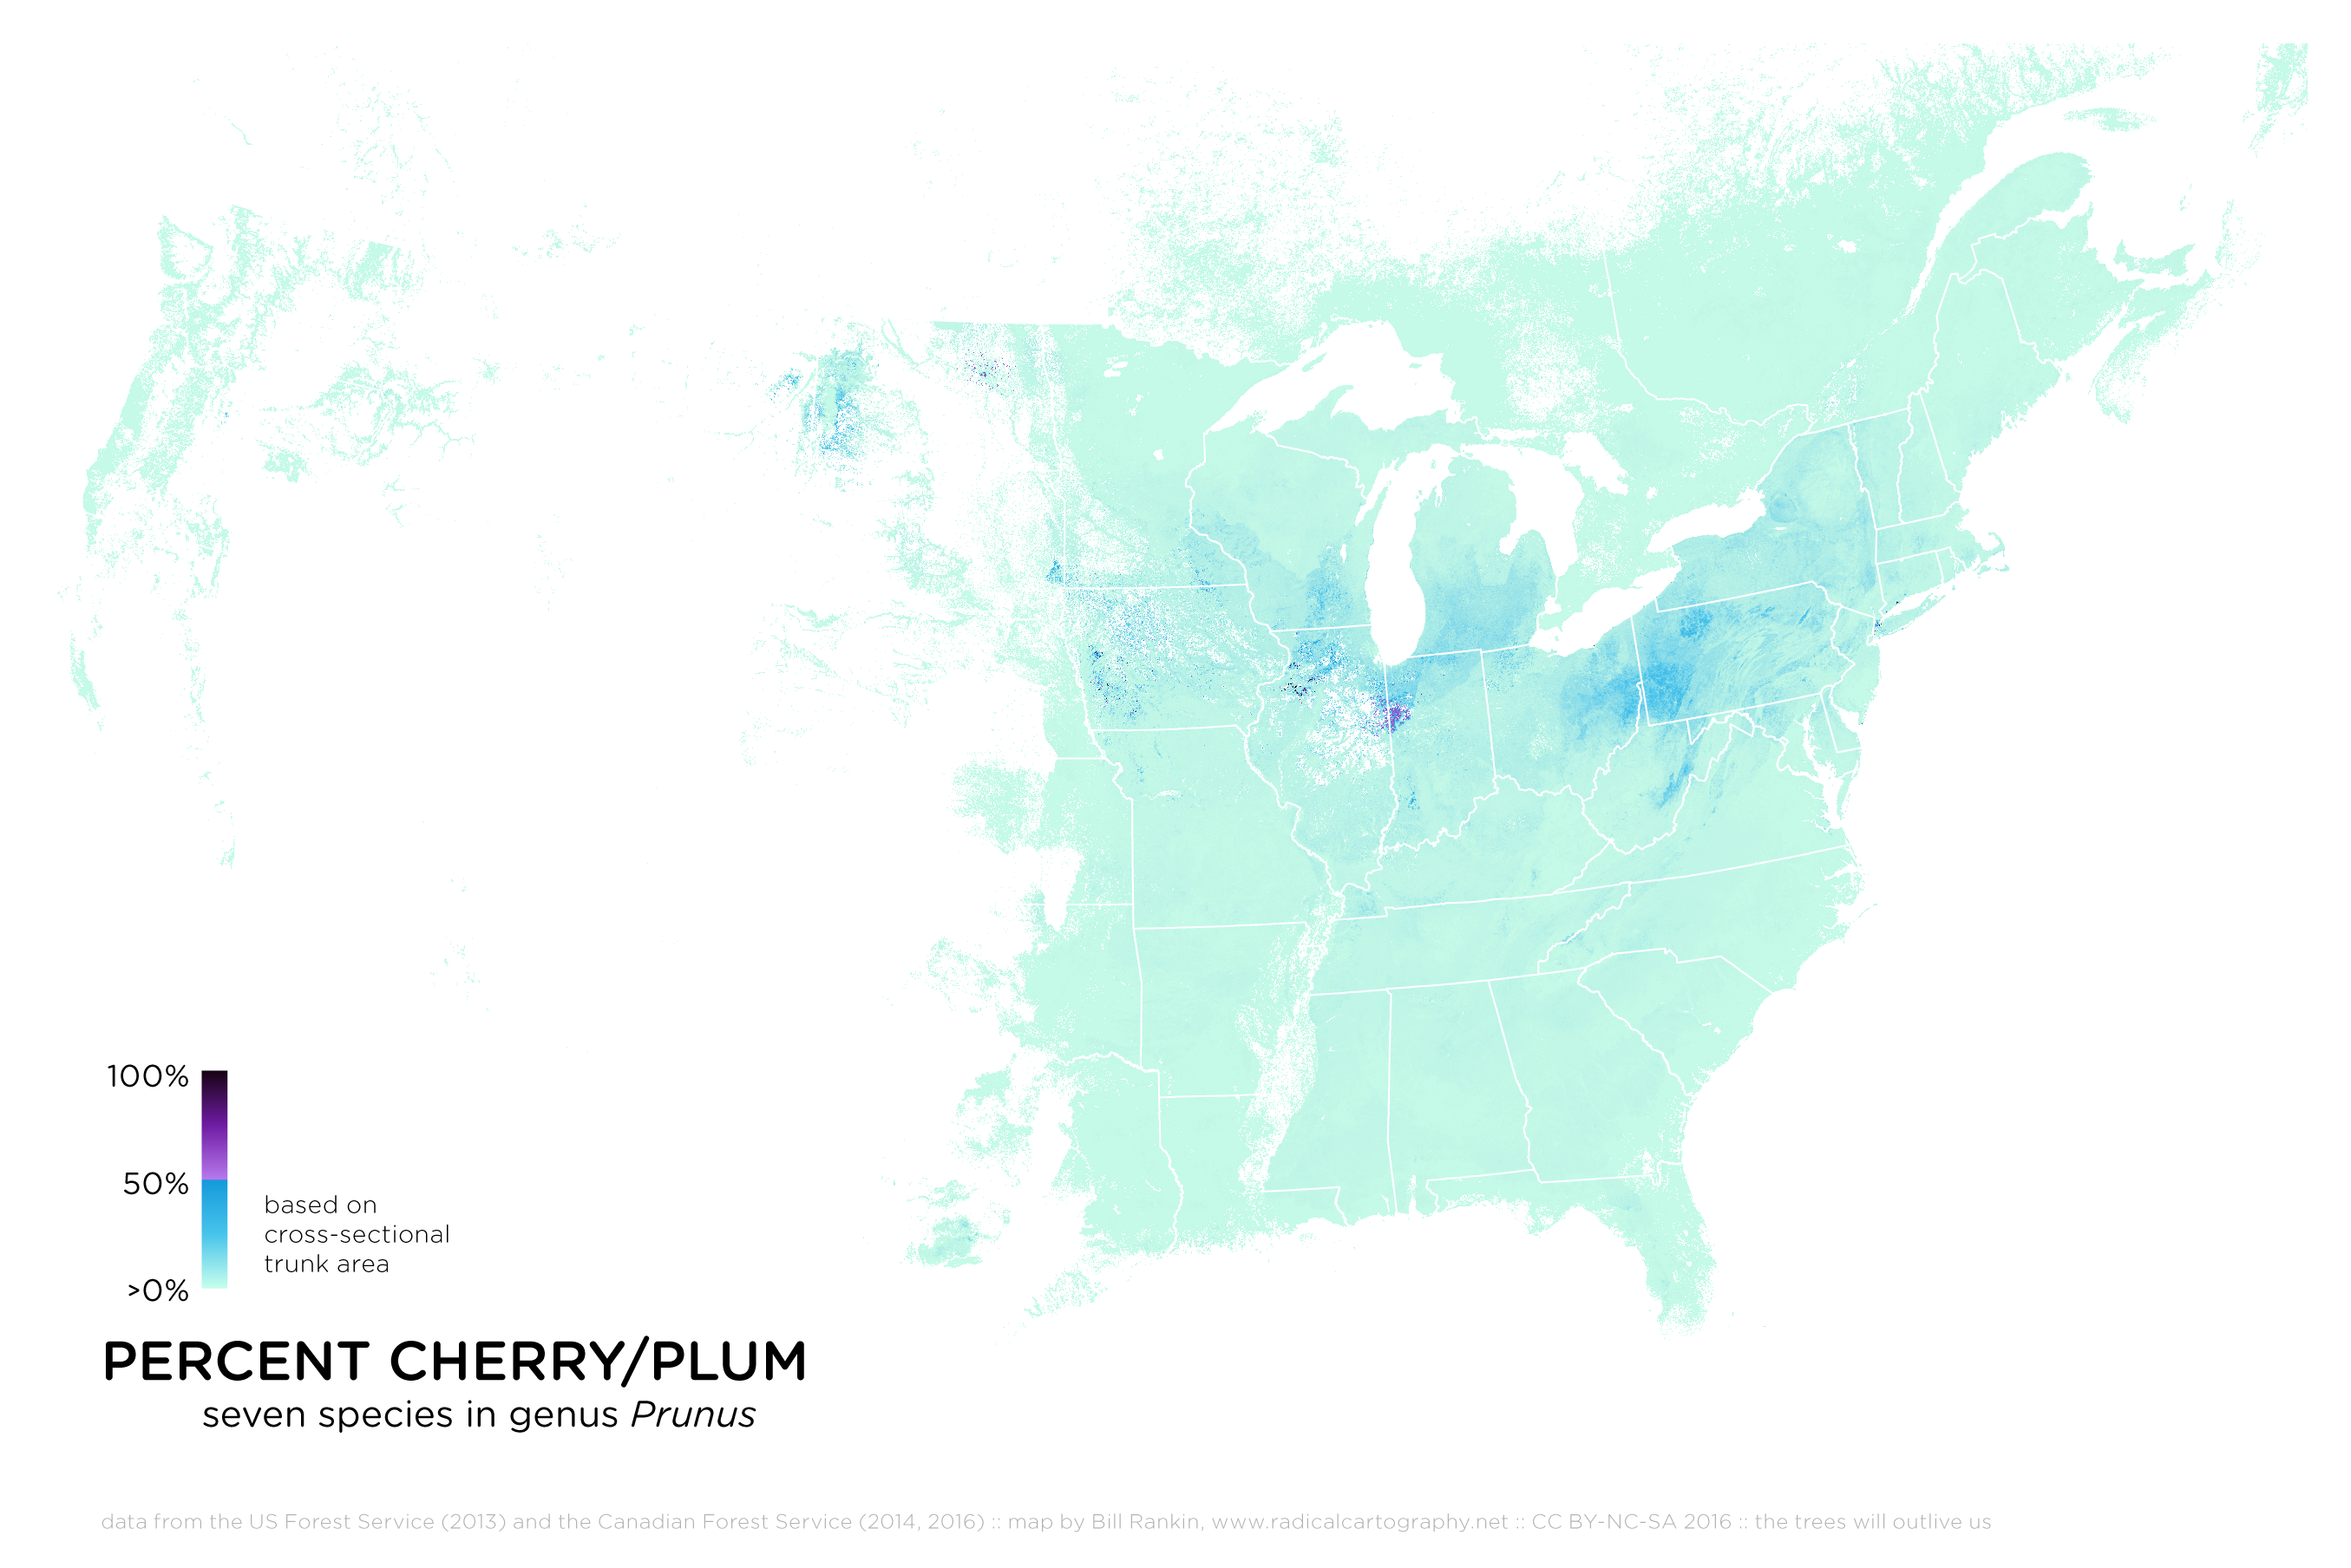
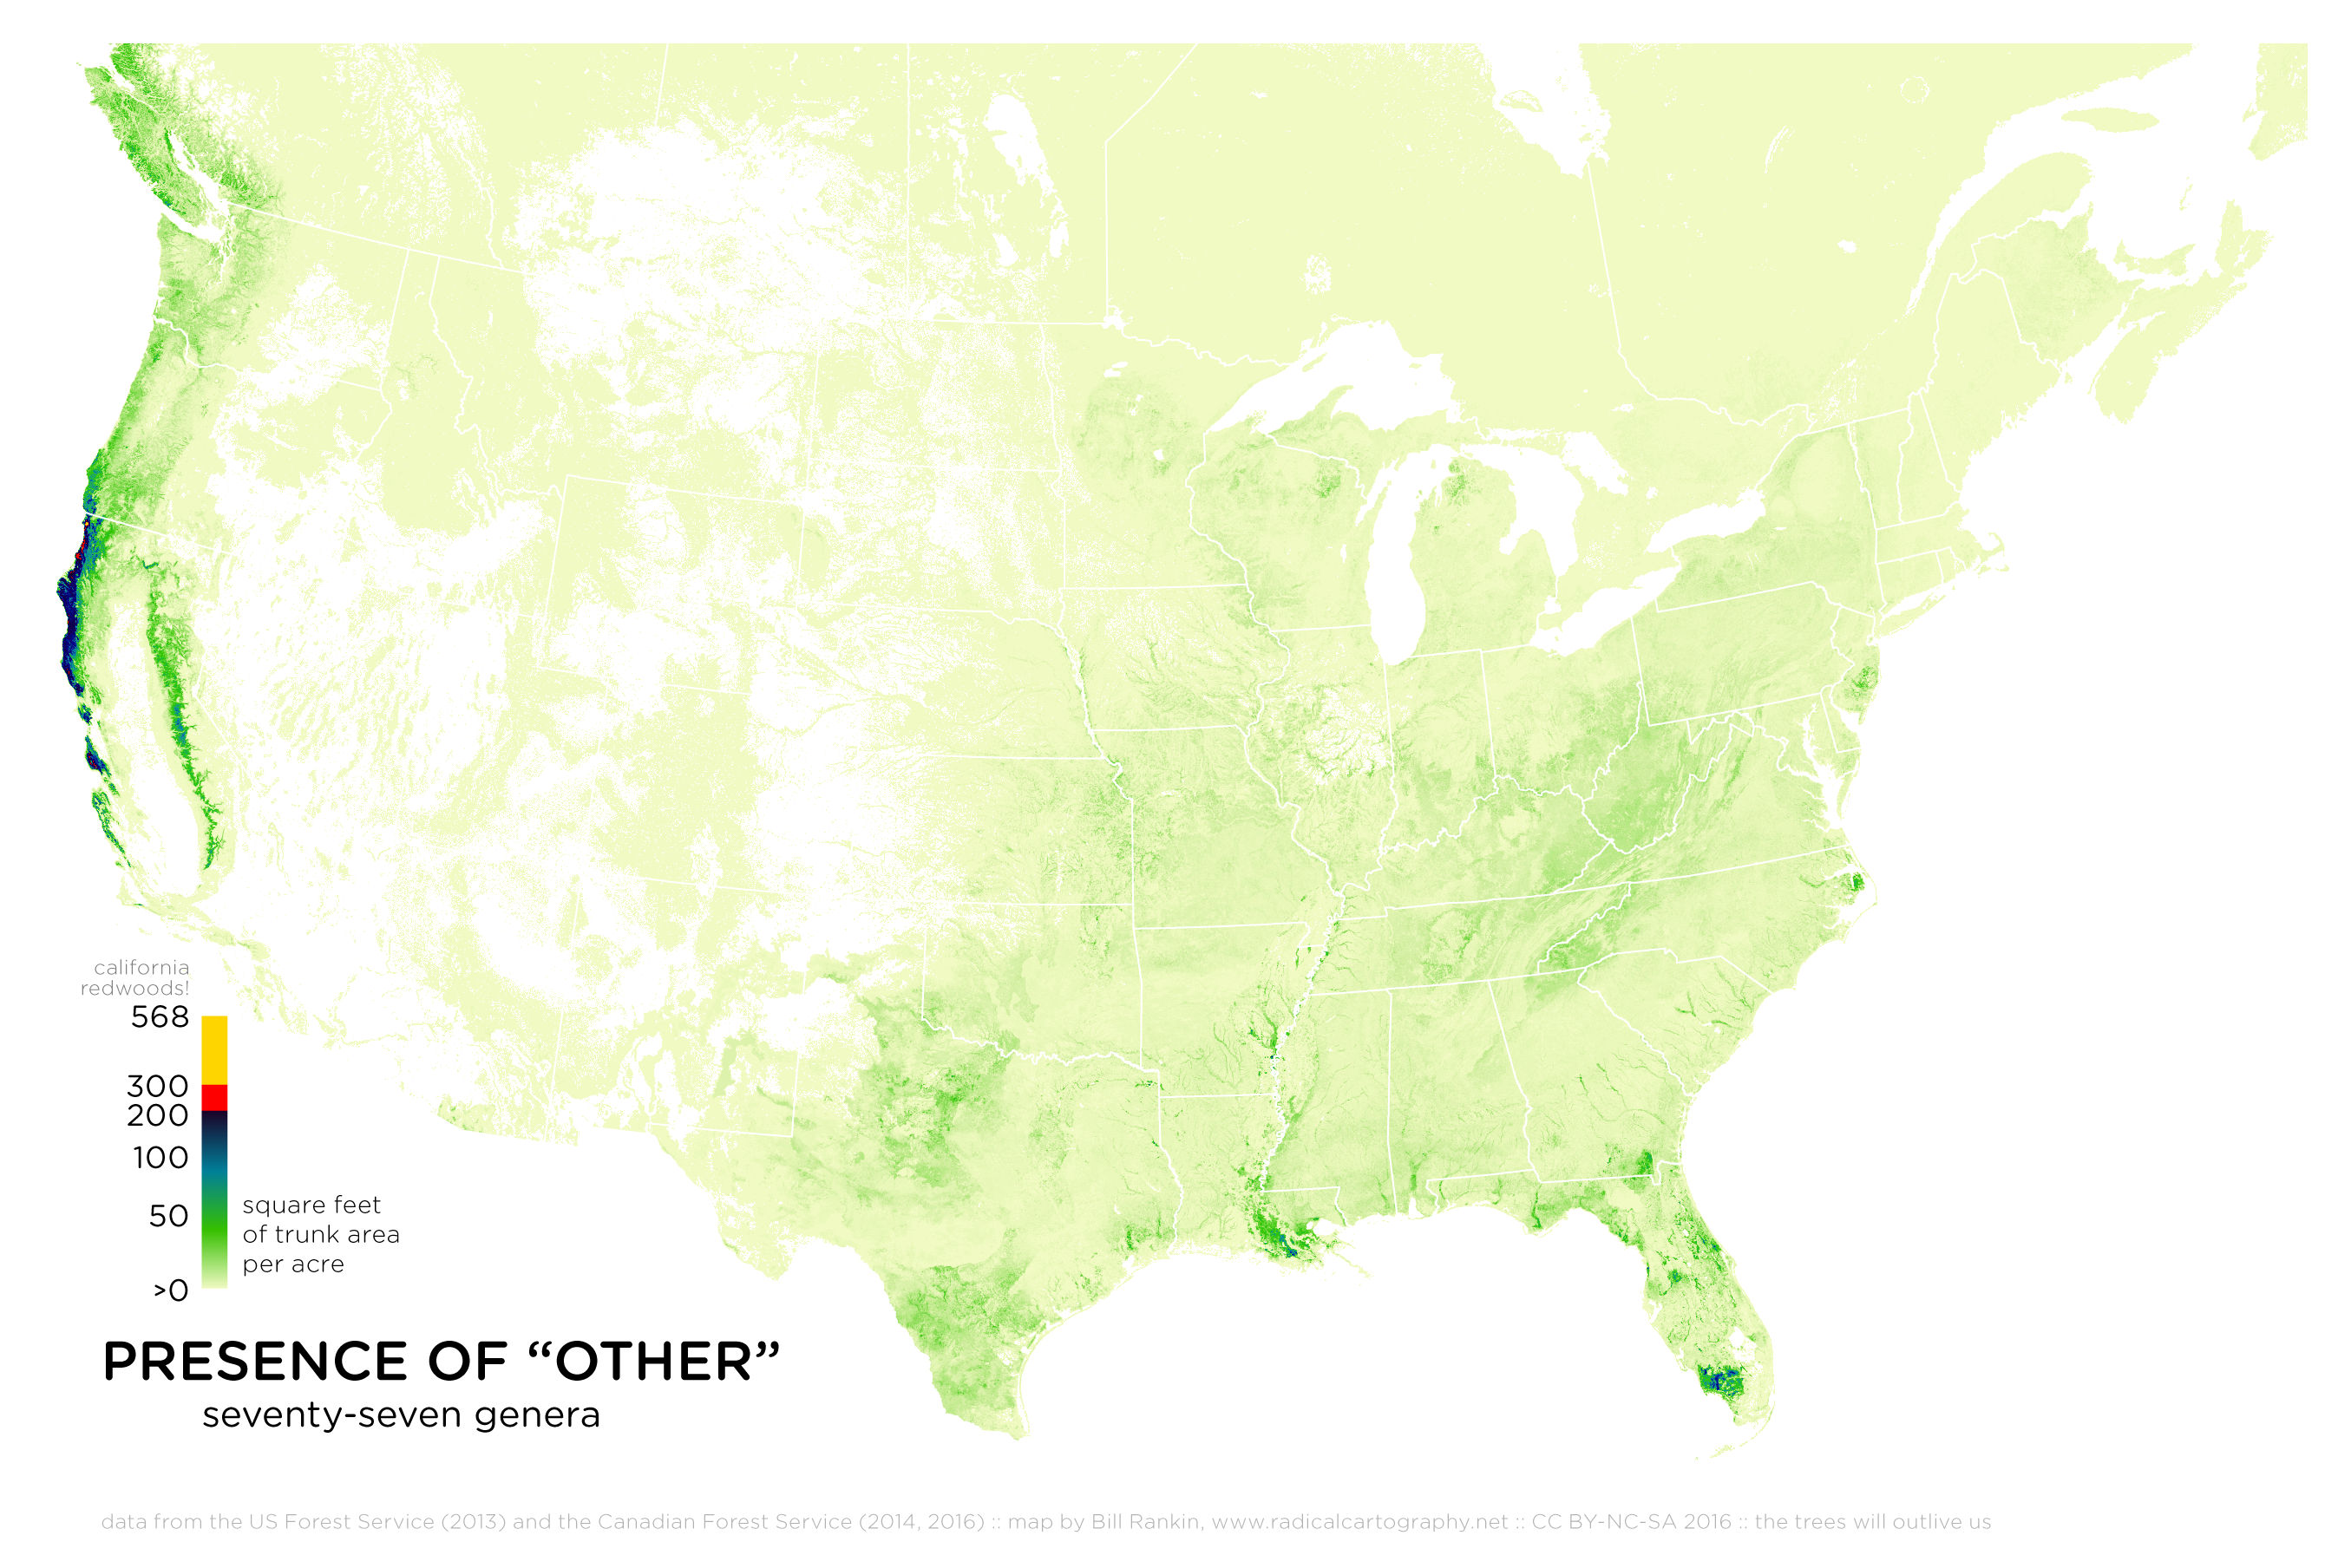
Birch (%), Poplar (%), Hemlock (%), Arborvitae (%), Larch (%), Ash (%), Sweetgum (%), Hickory (%), Tuliptree (%), Beech (%), Elm (%), Tupelo (%), Cherry/Plum (%), all other (%)


Bill Rankin, 2016
click on any image to download high-res version (one pixel = 2 km)
or download all (.ZIP, 82 MB)
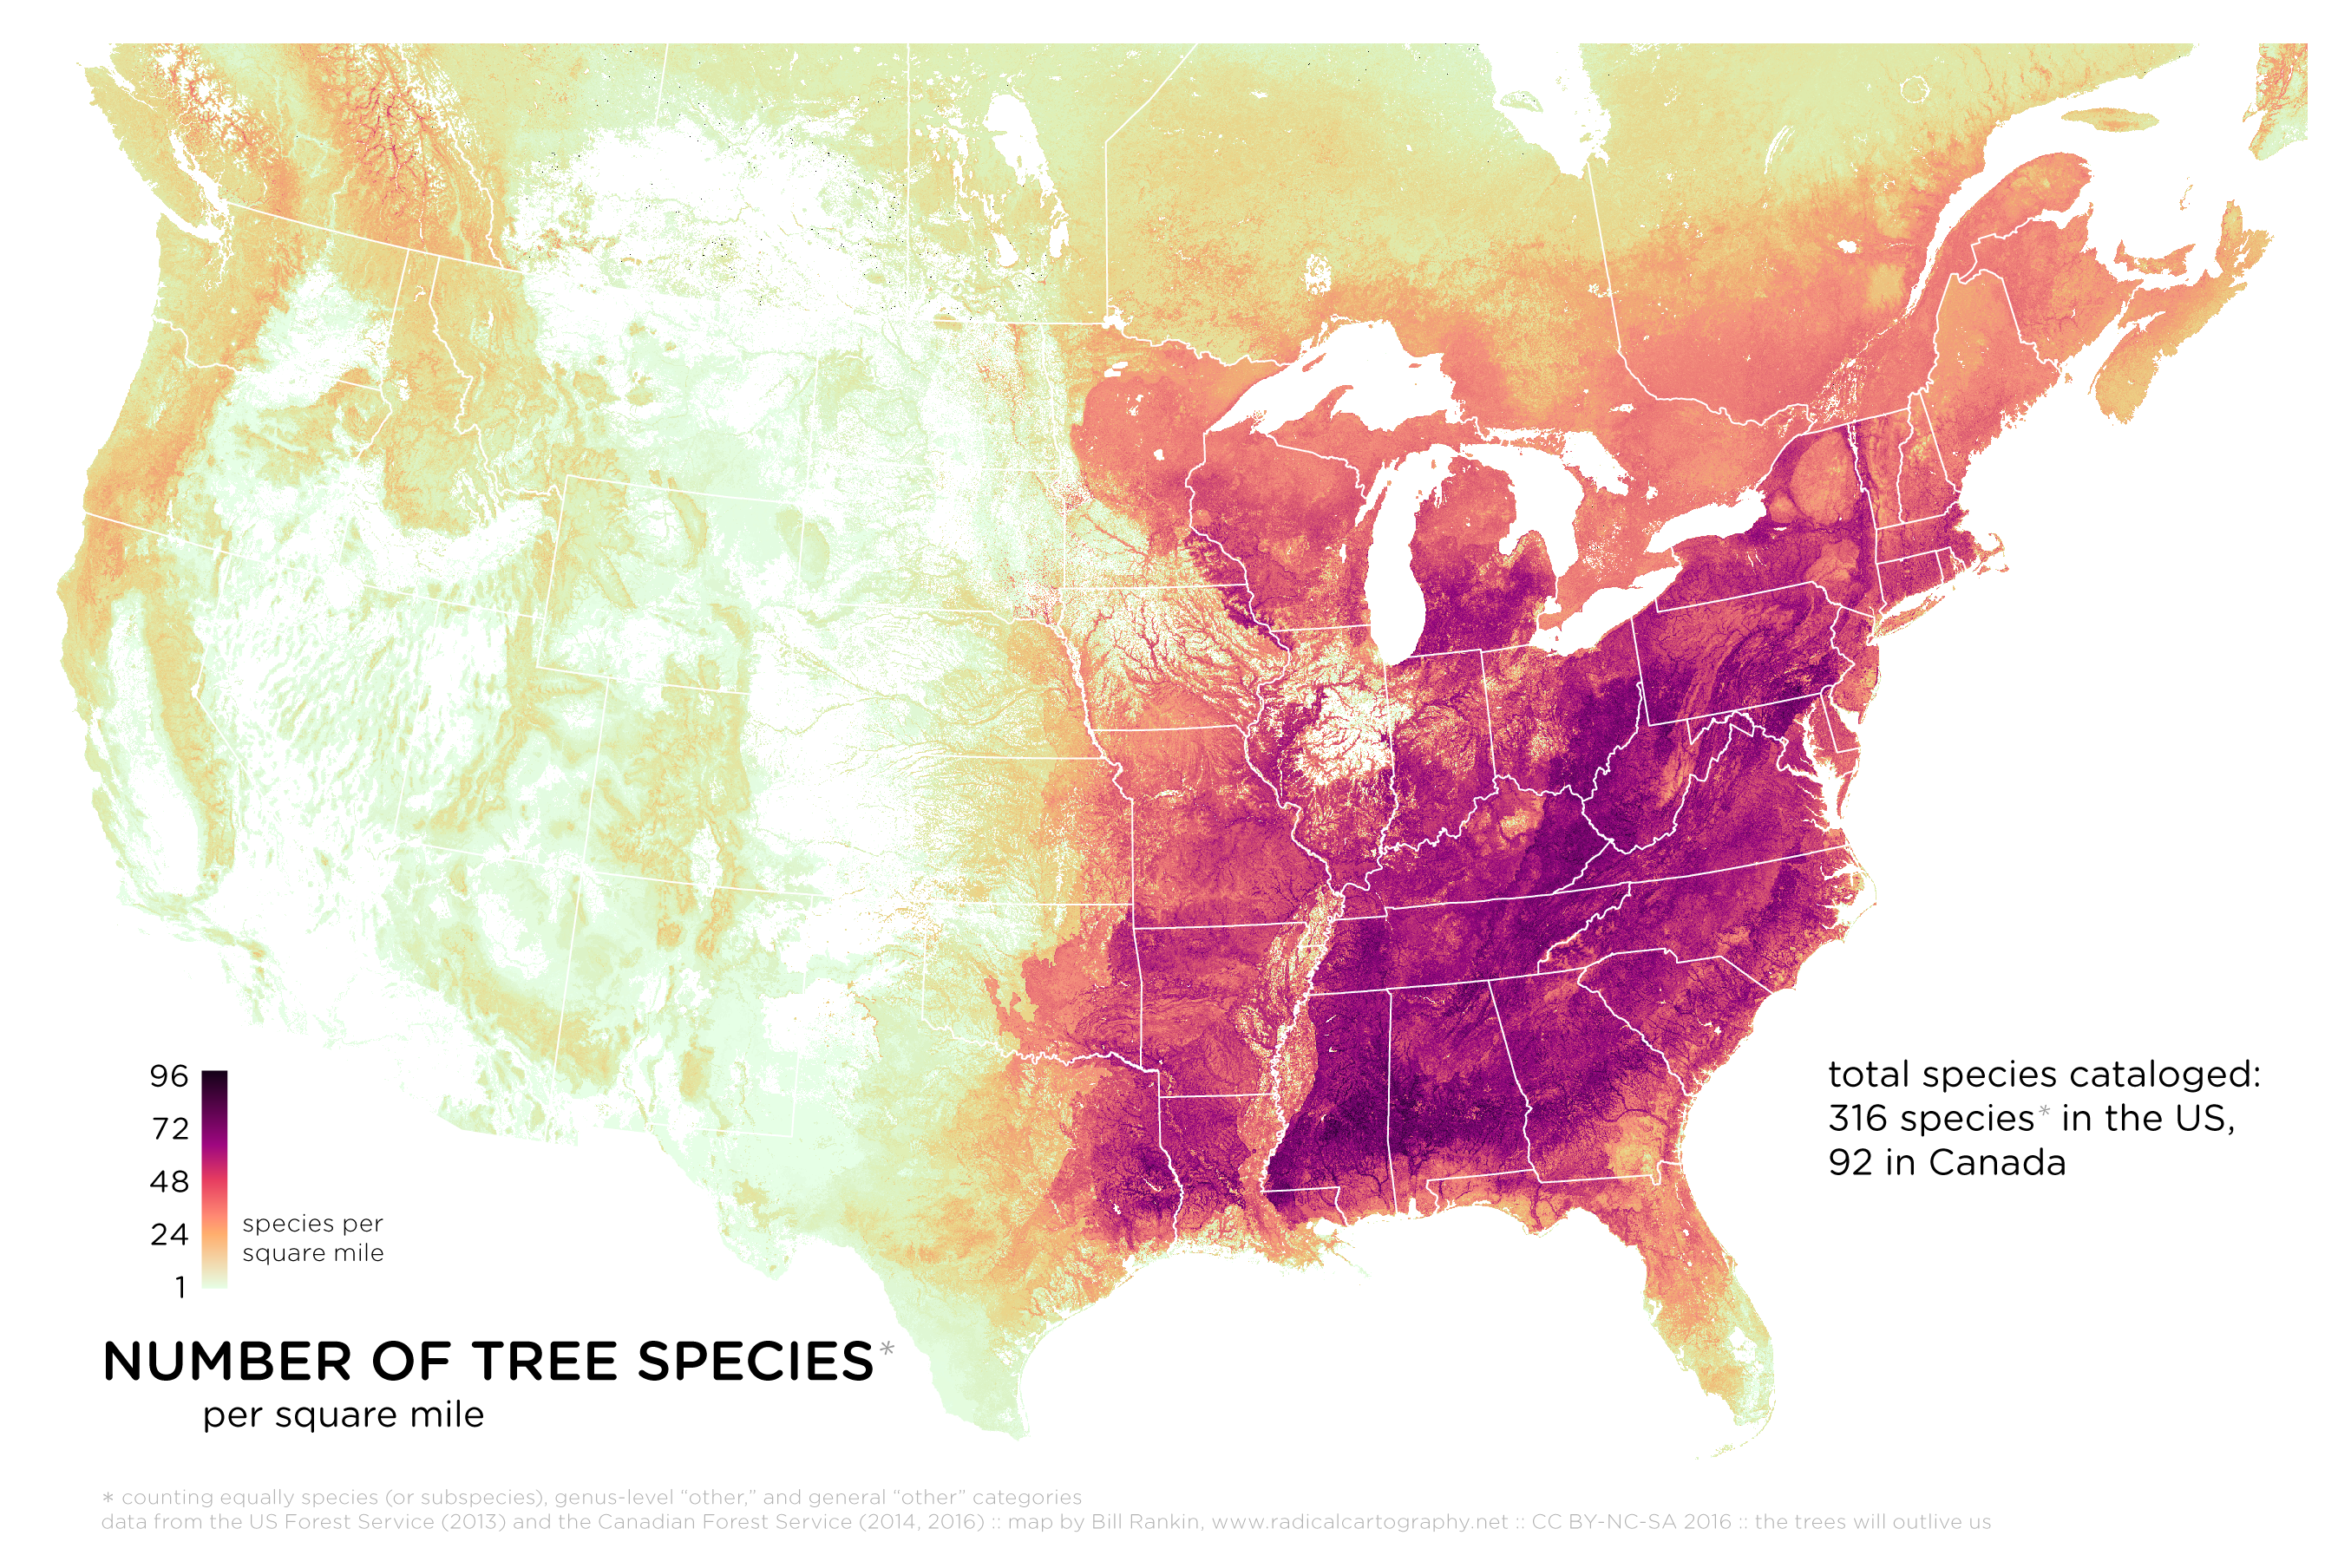
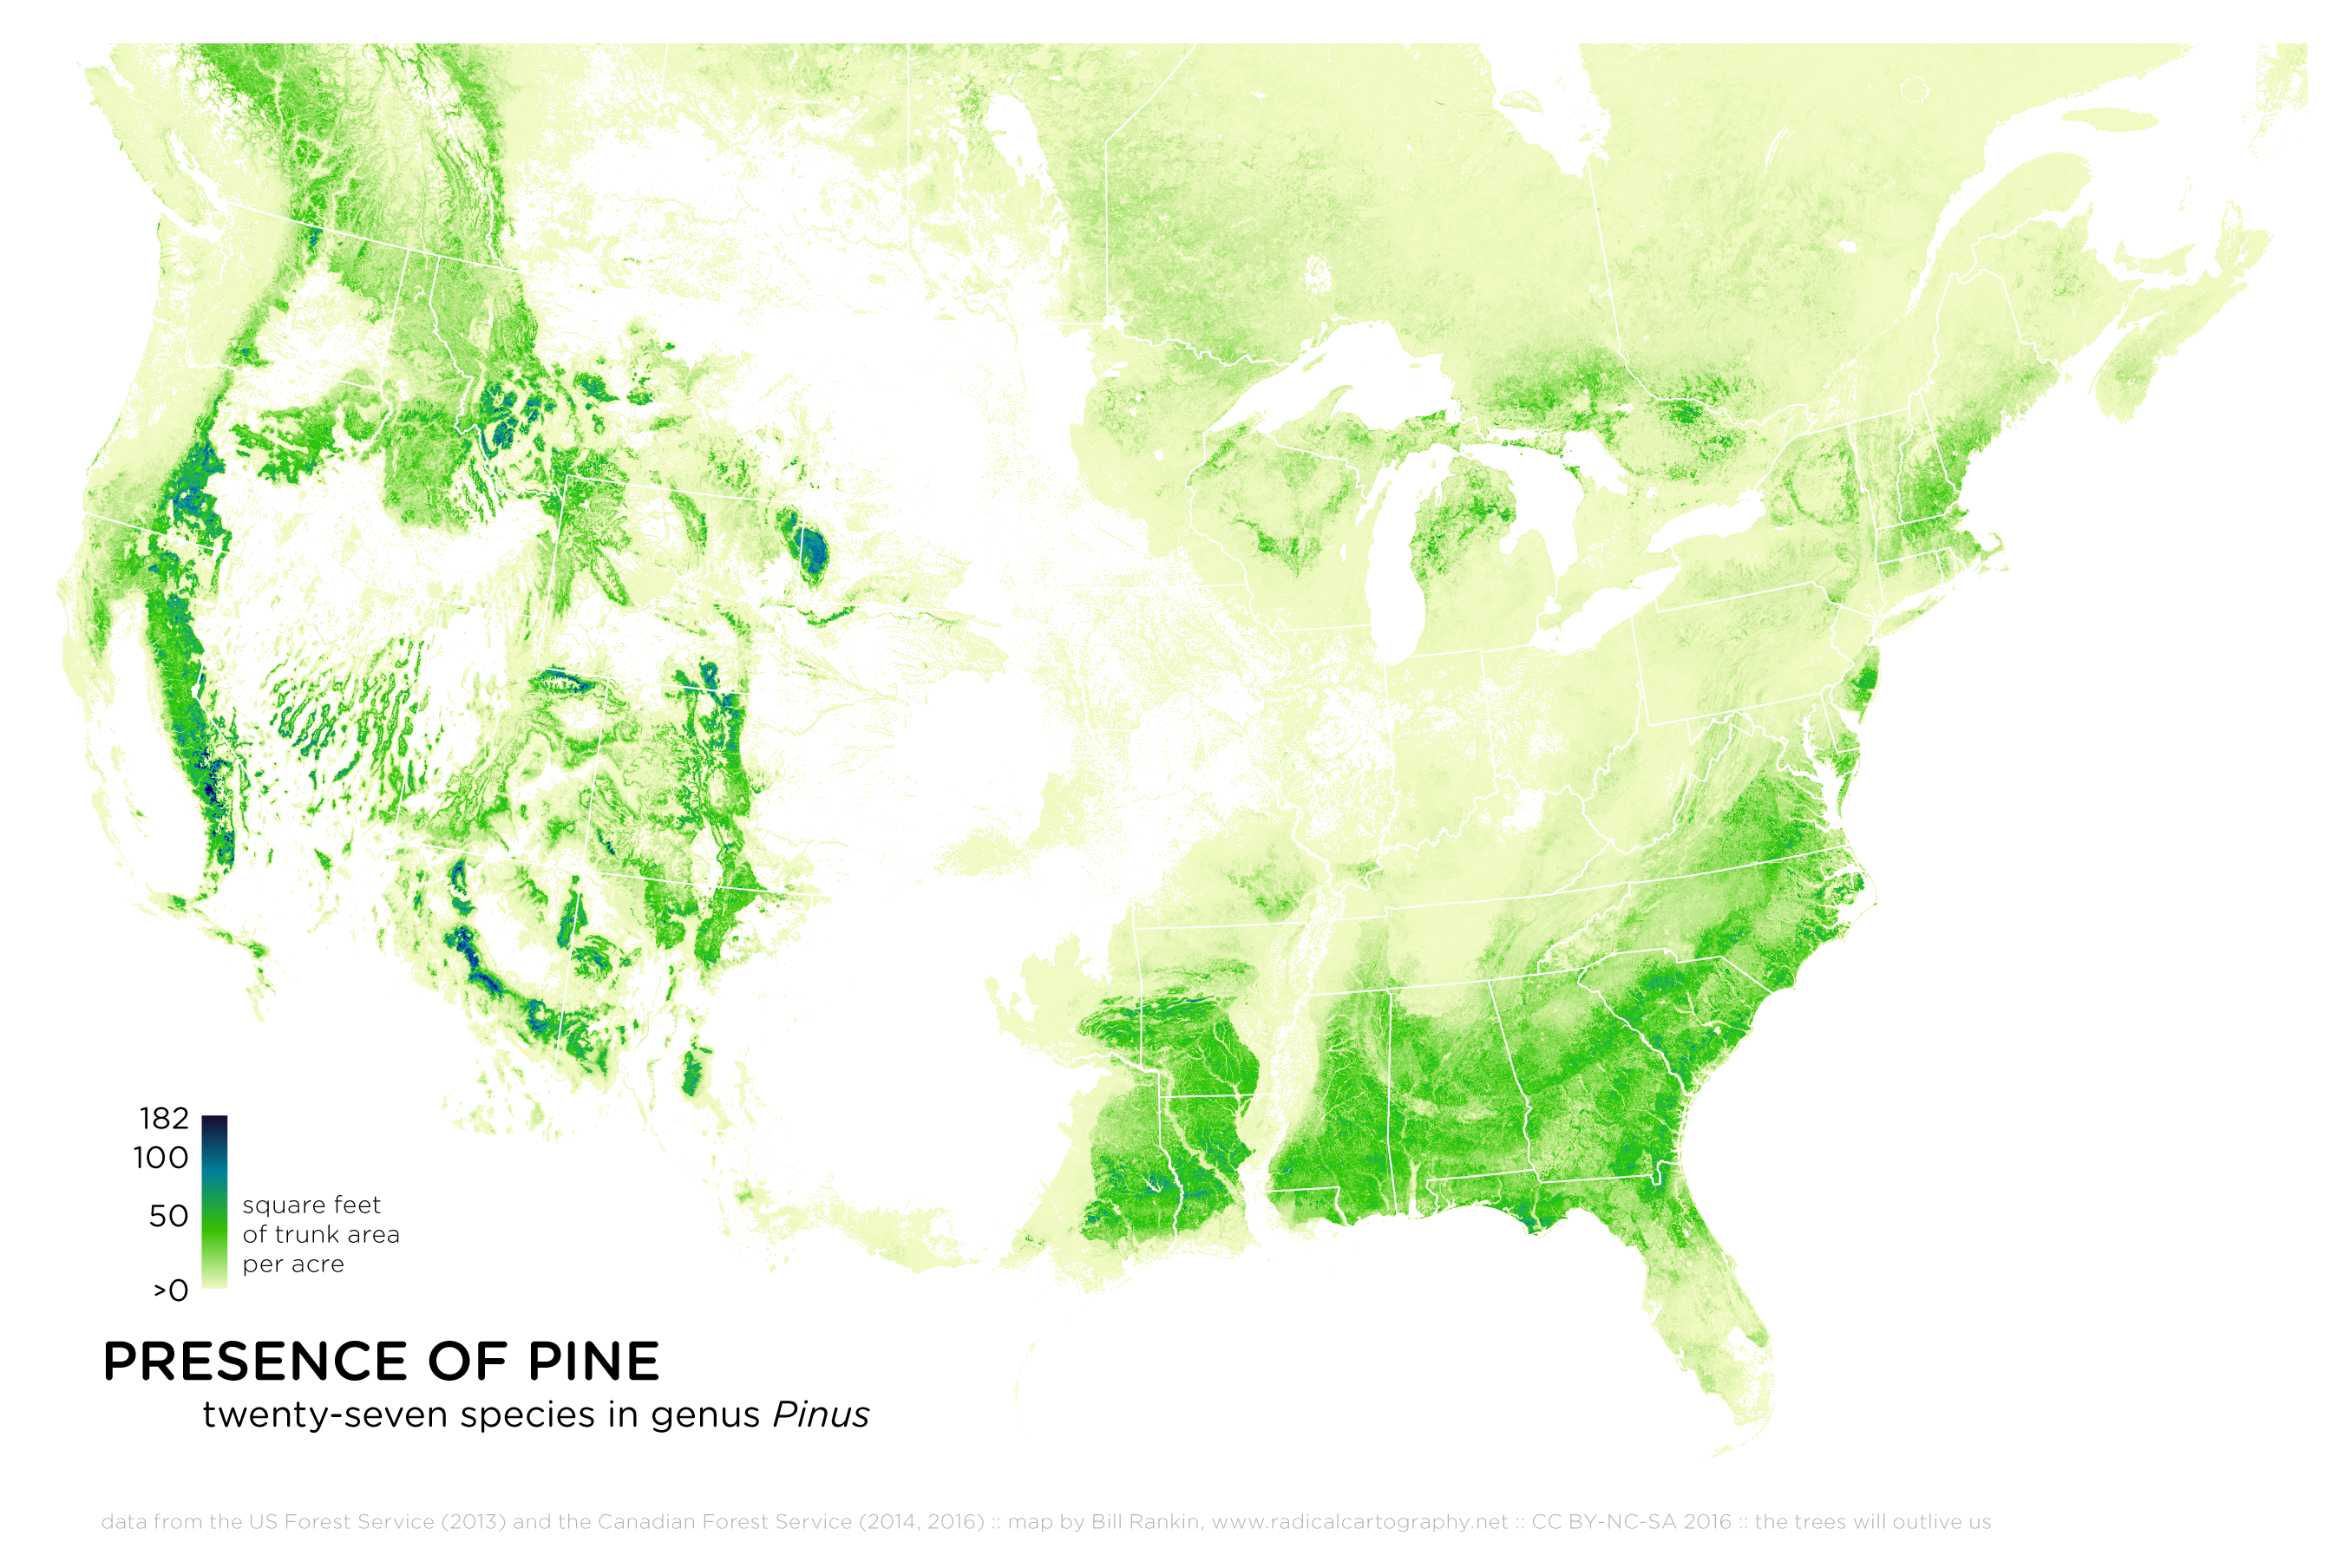
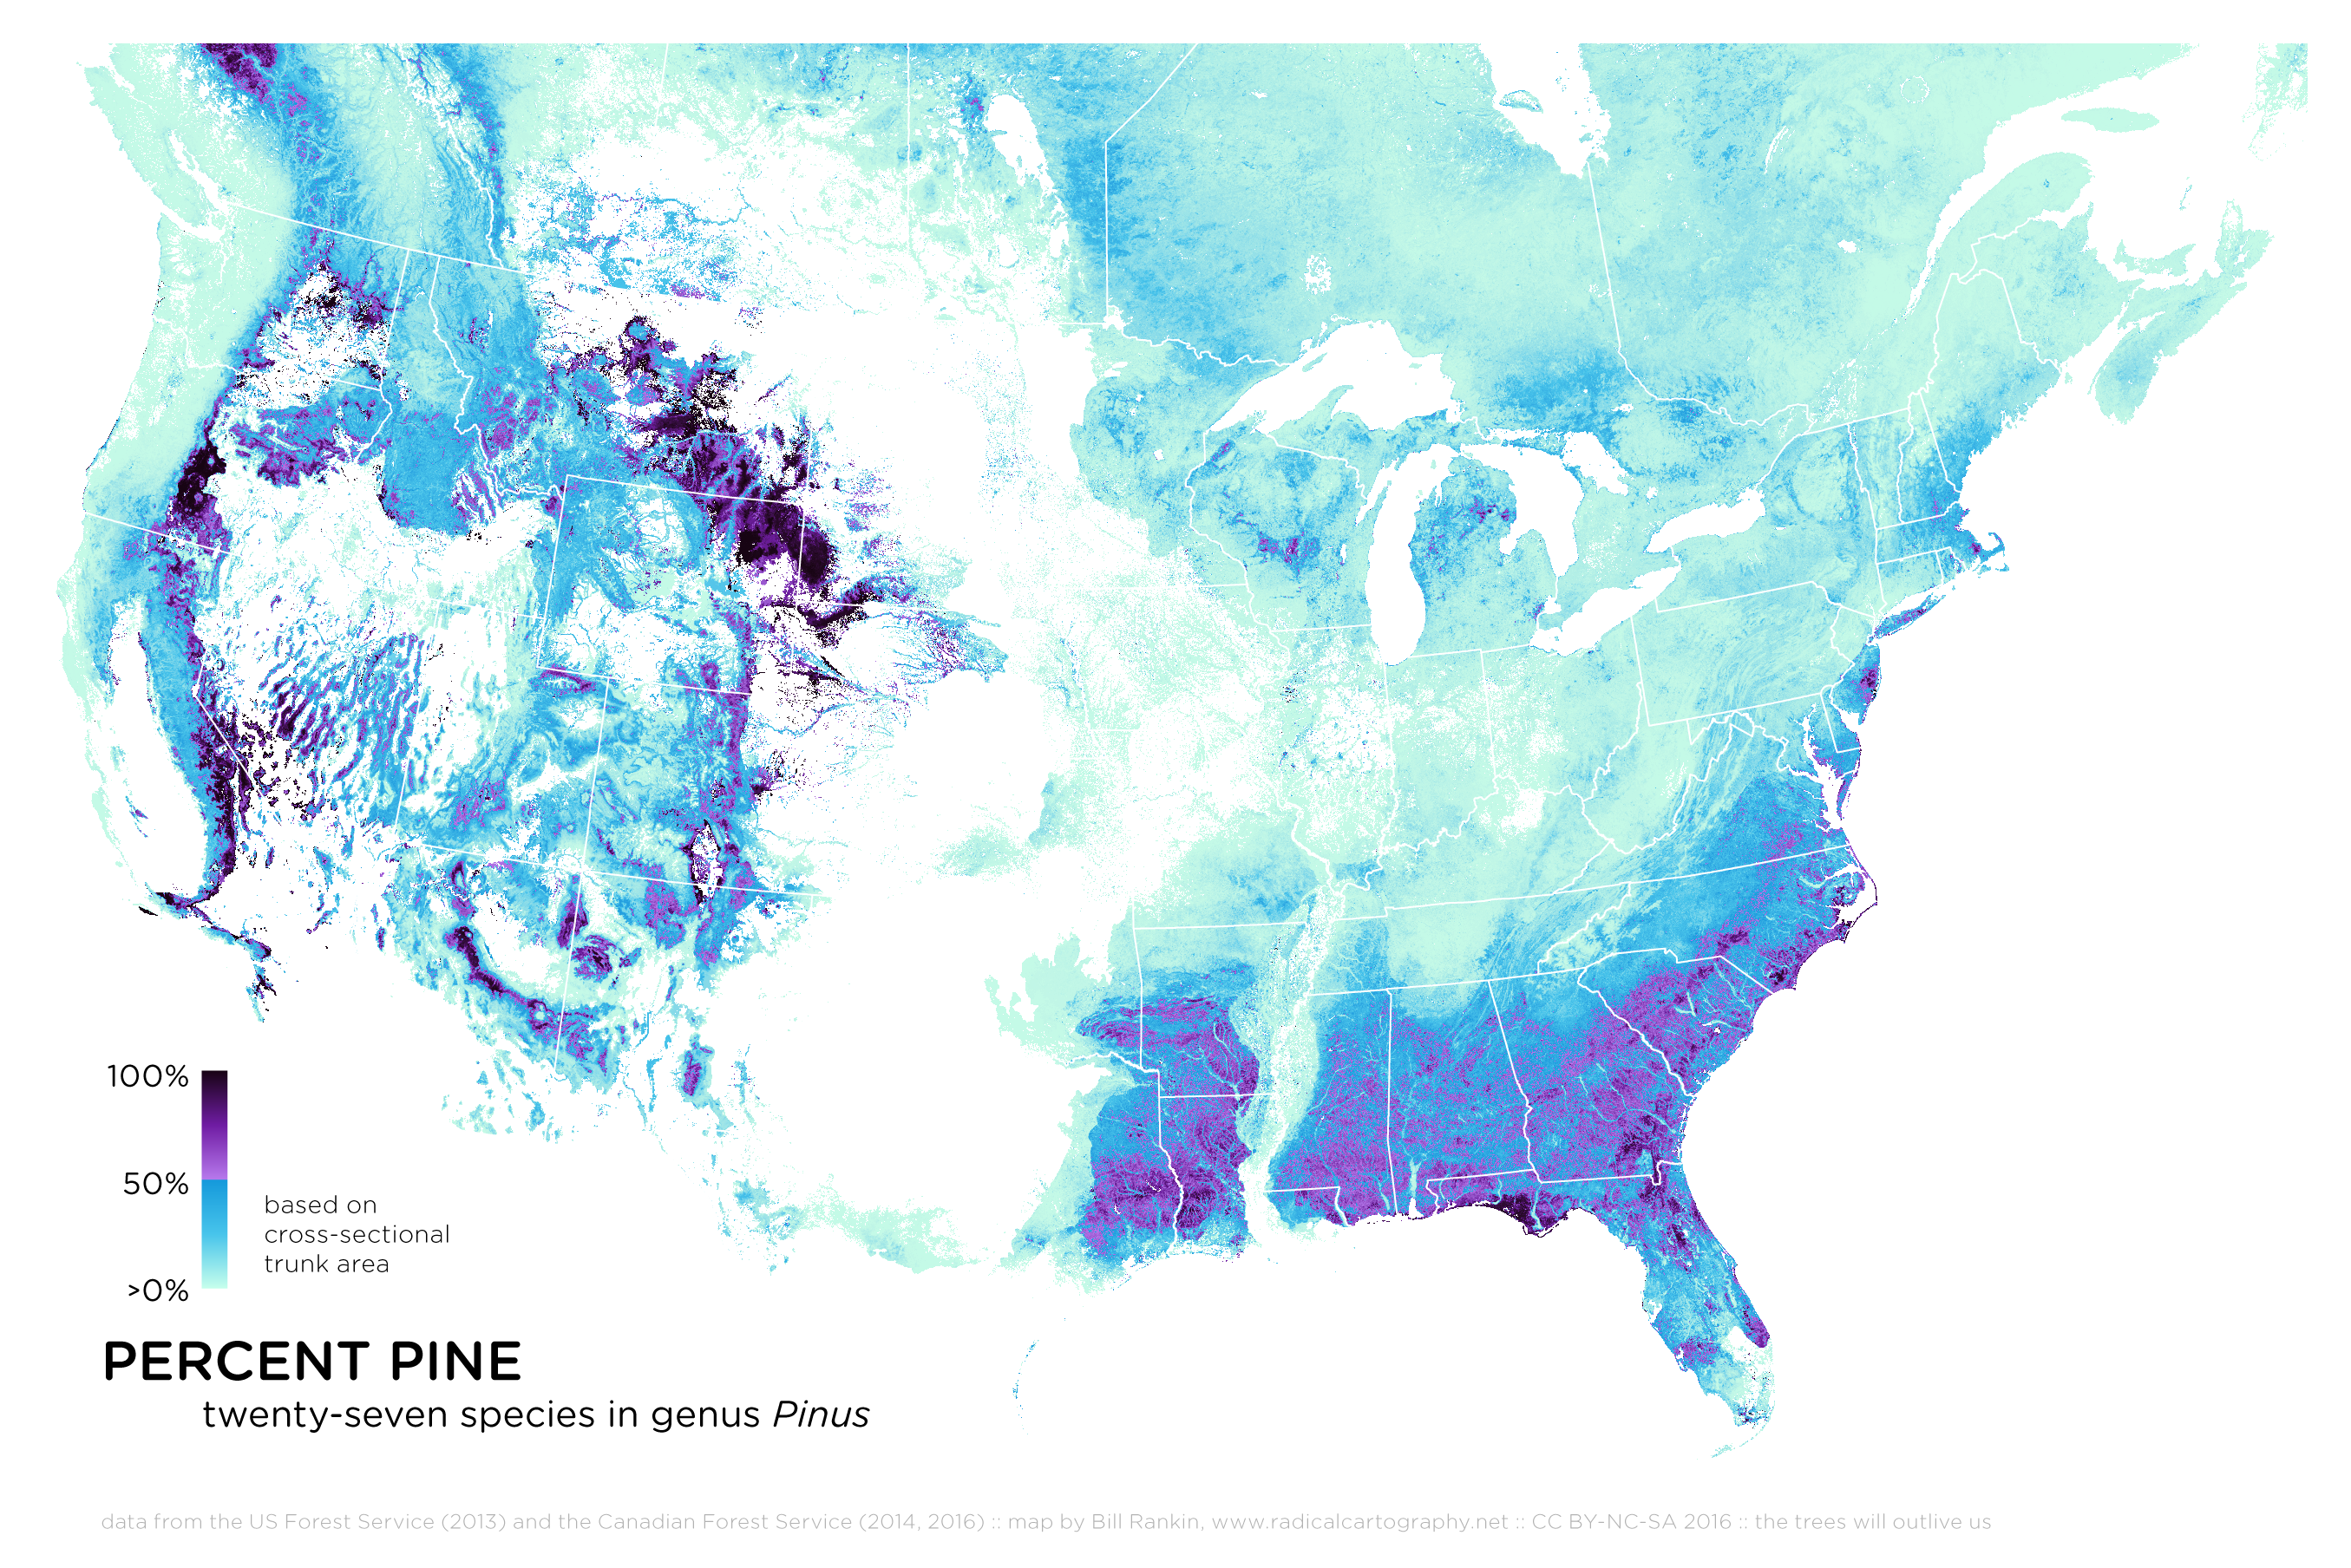
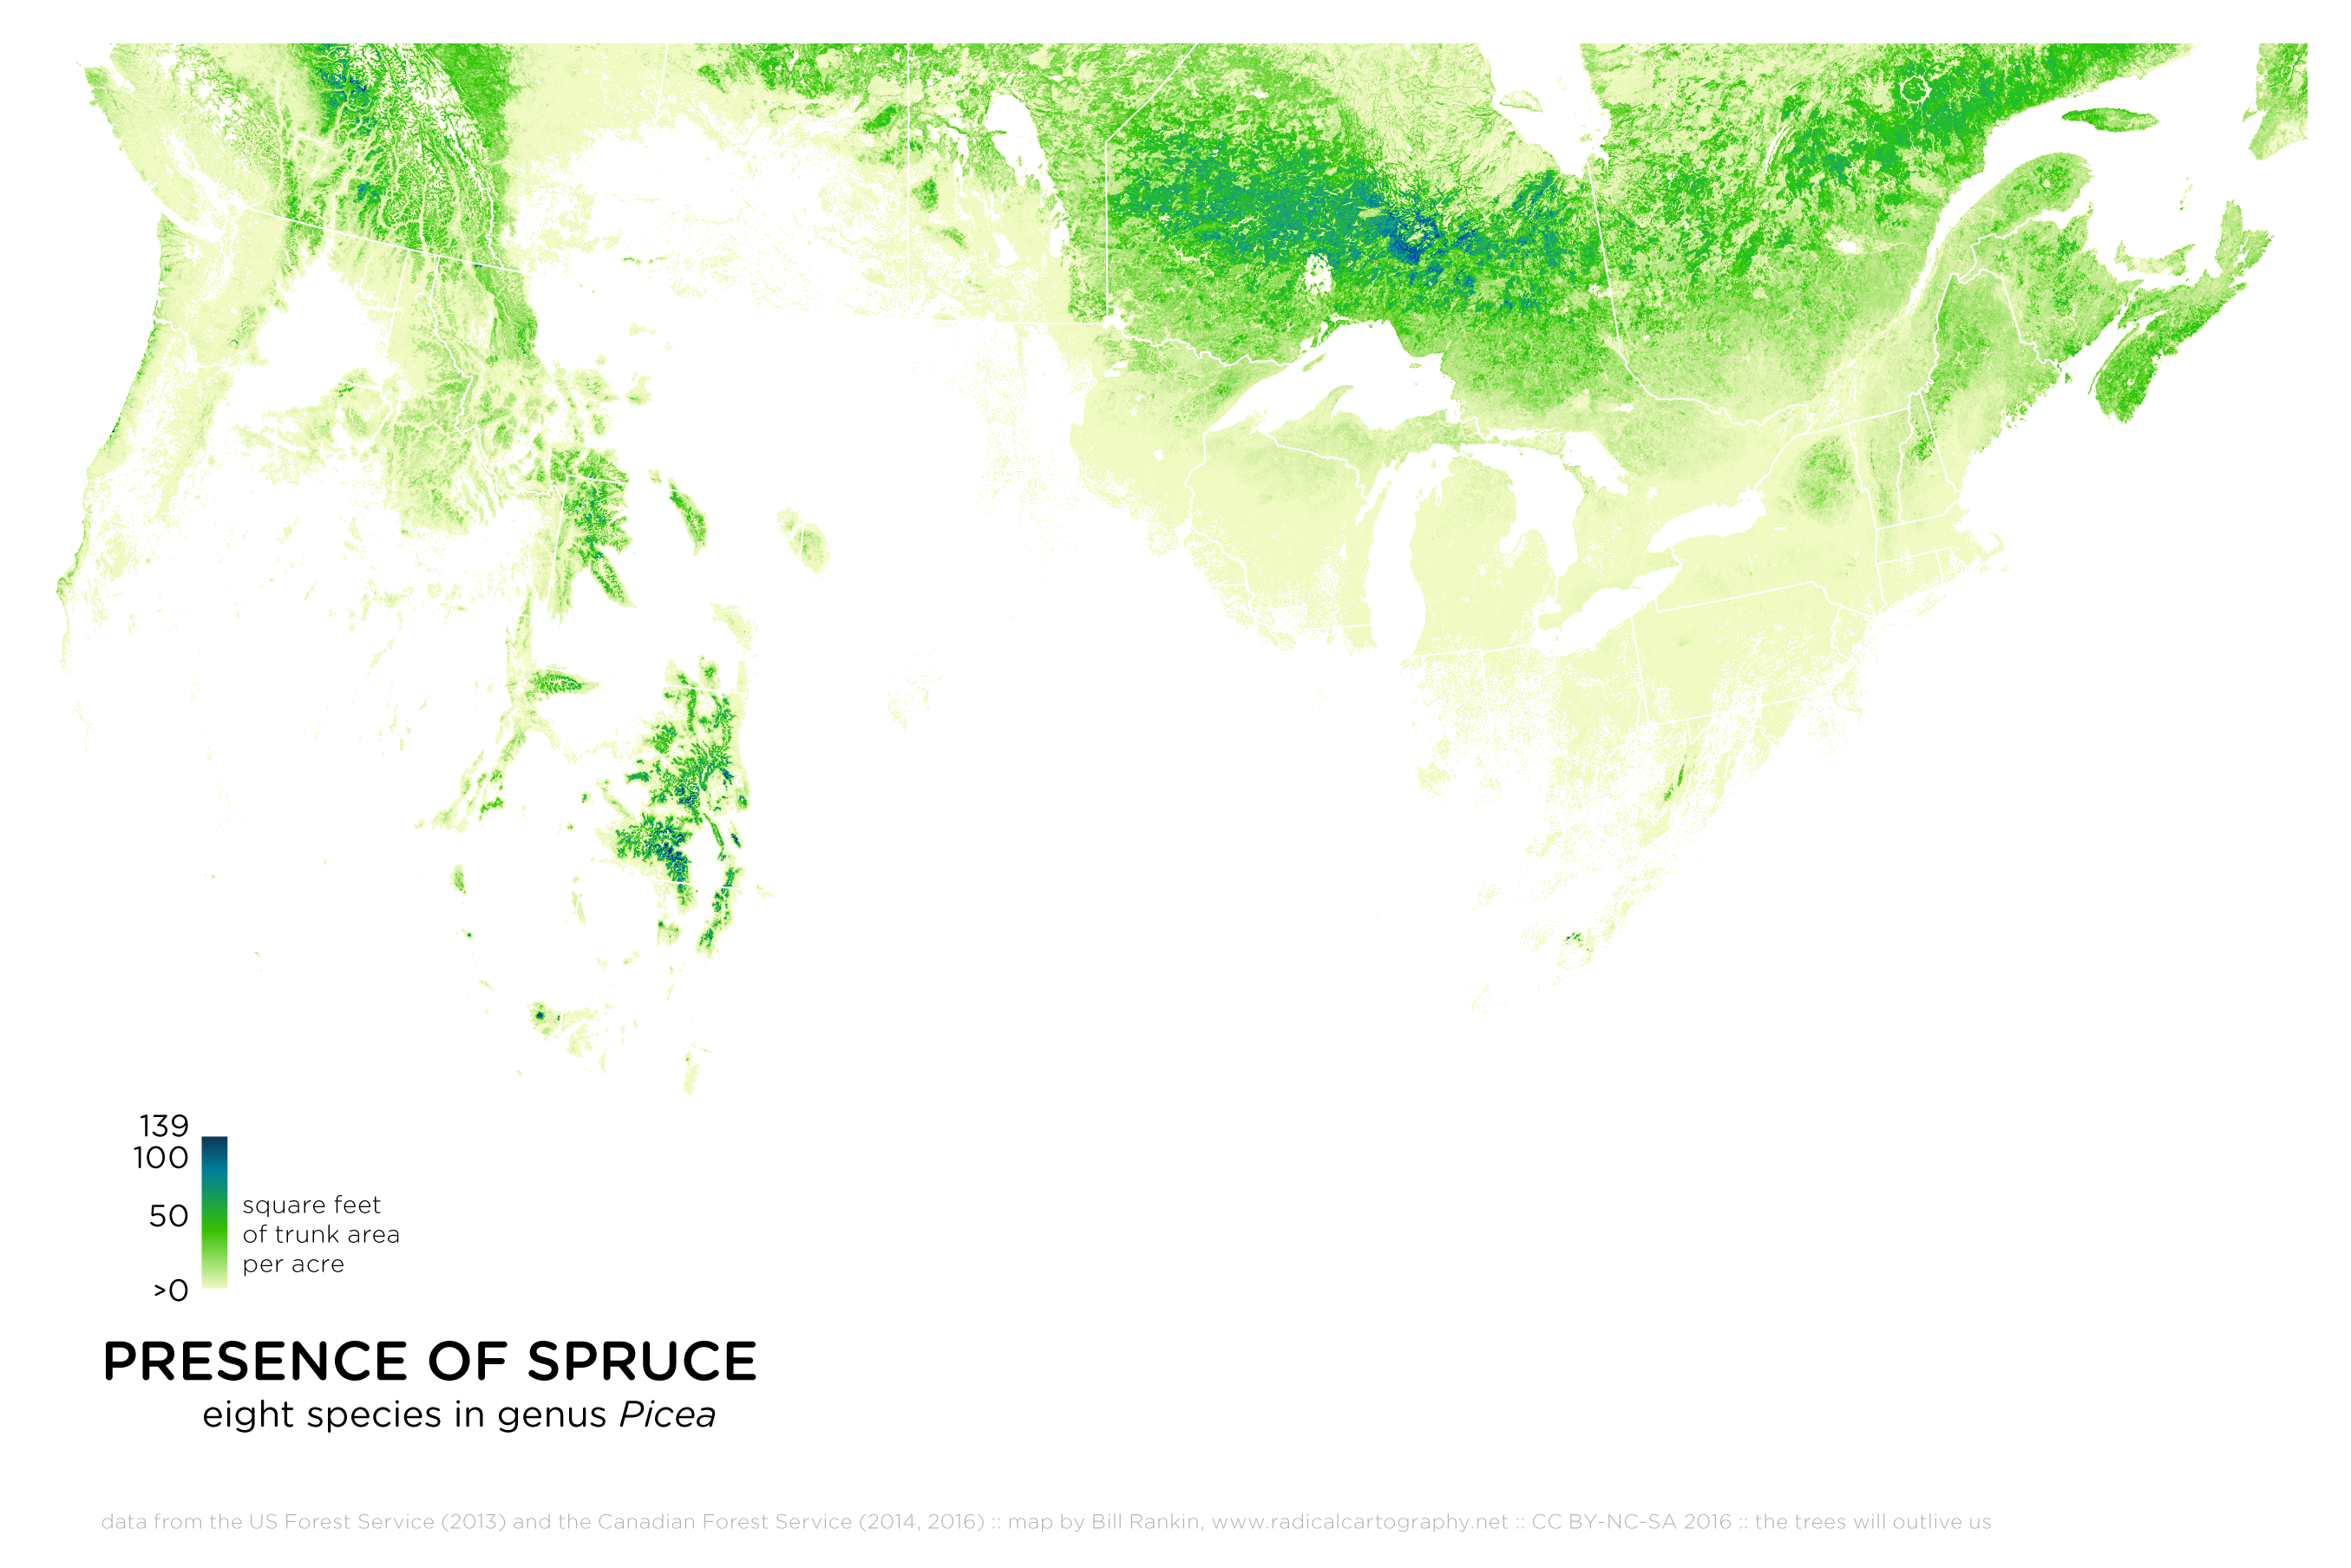
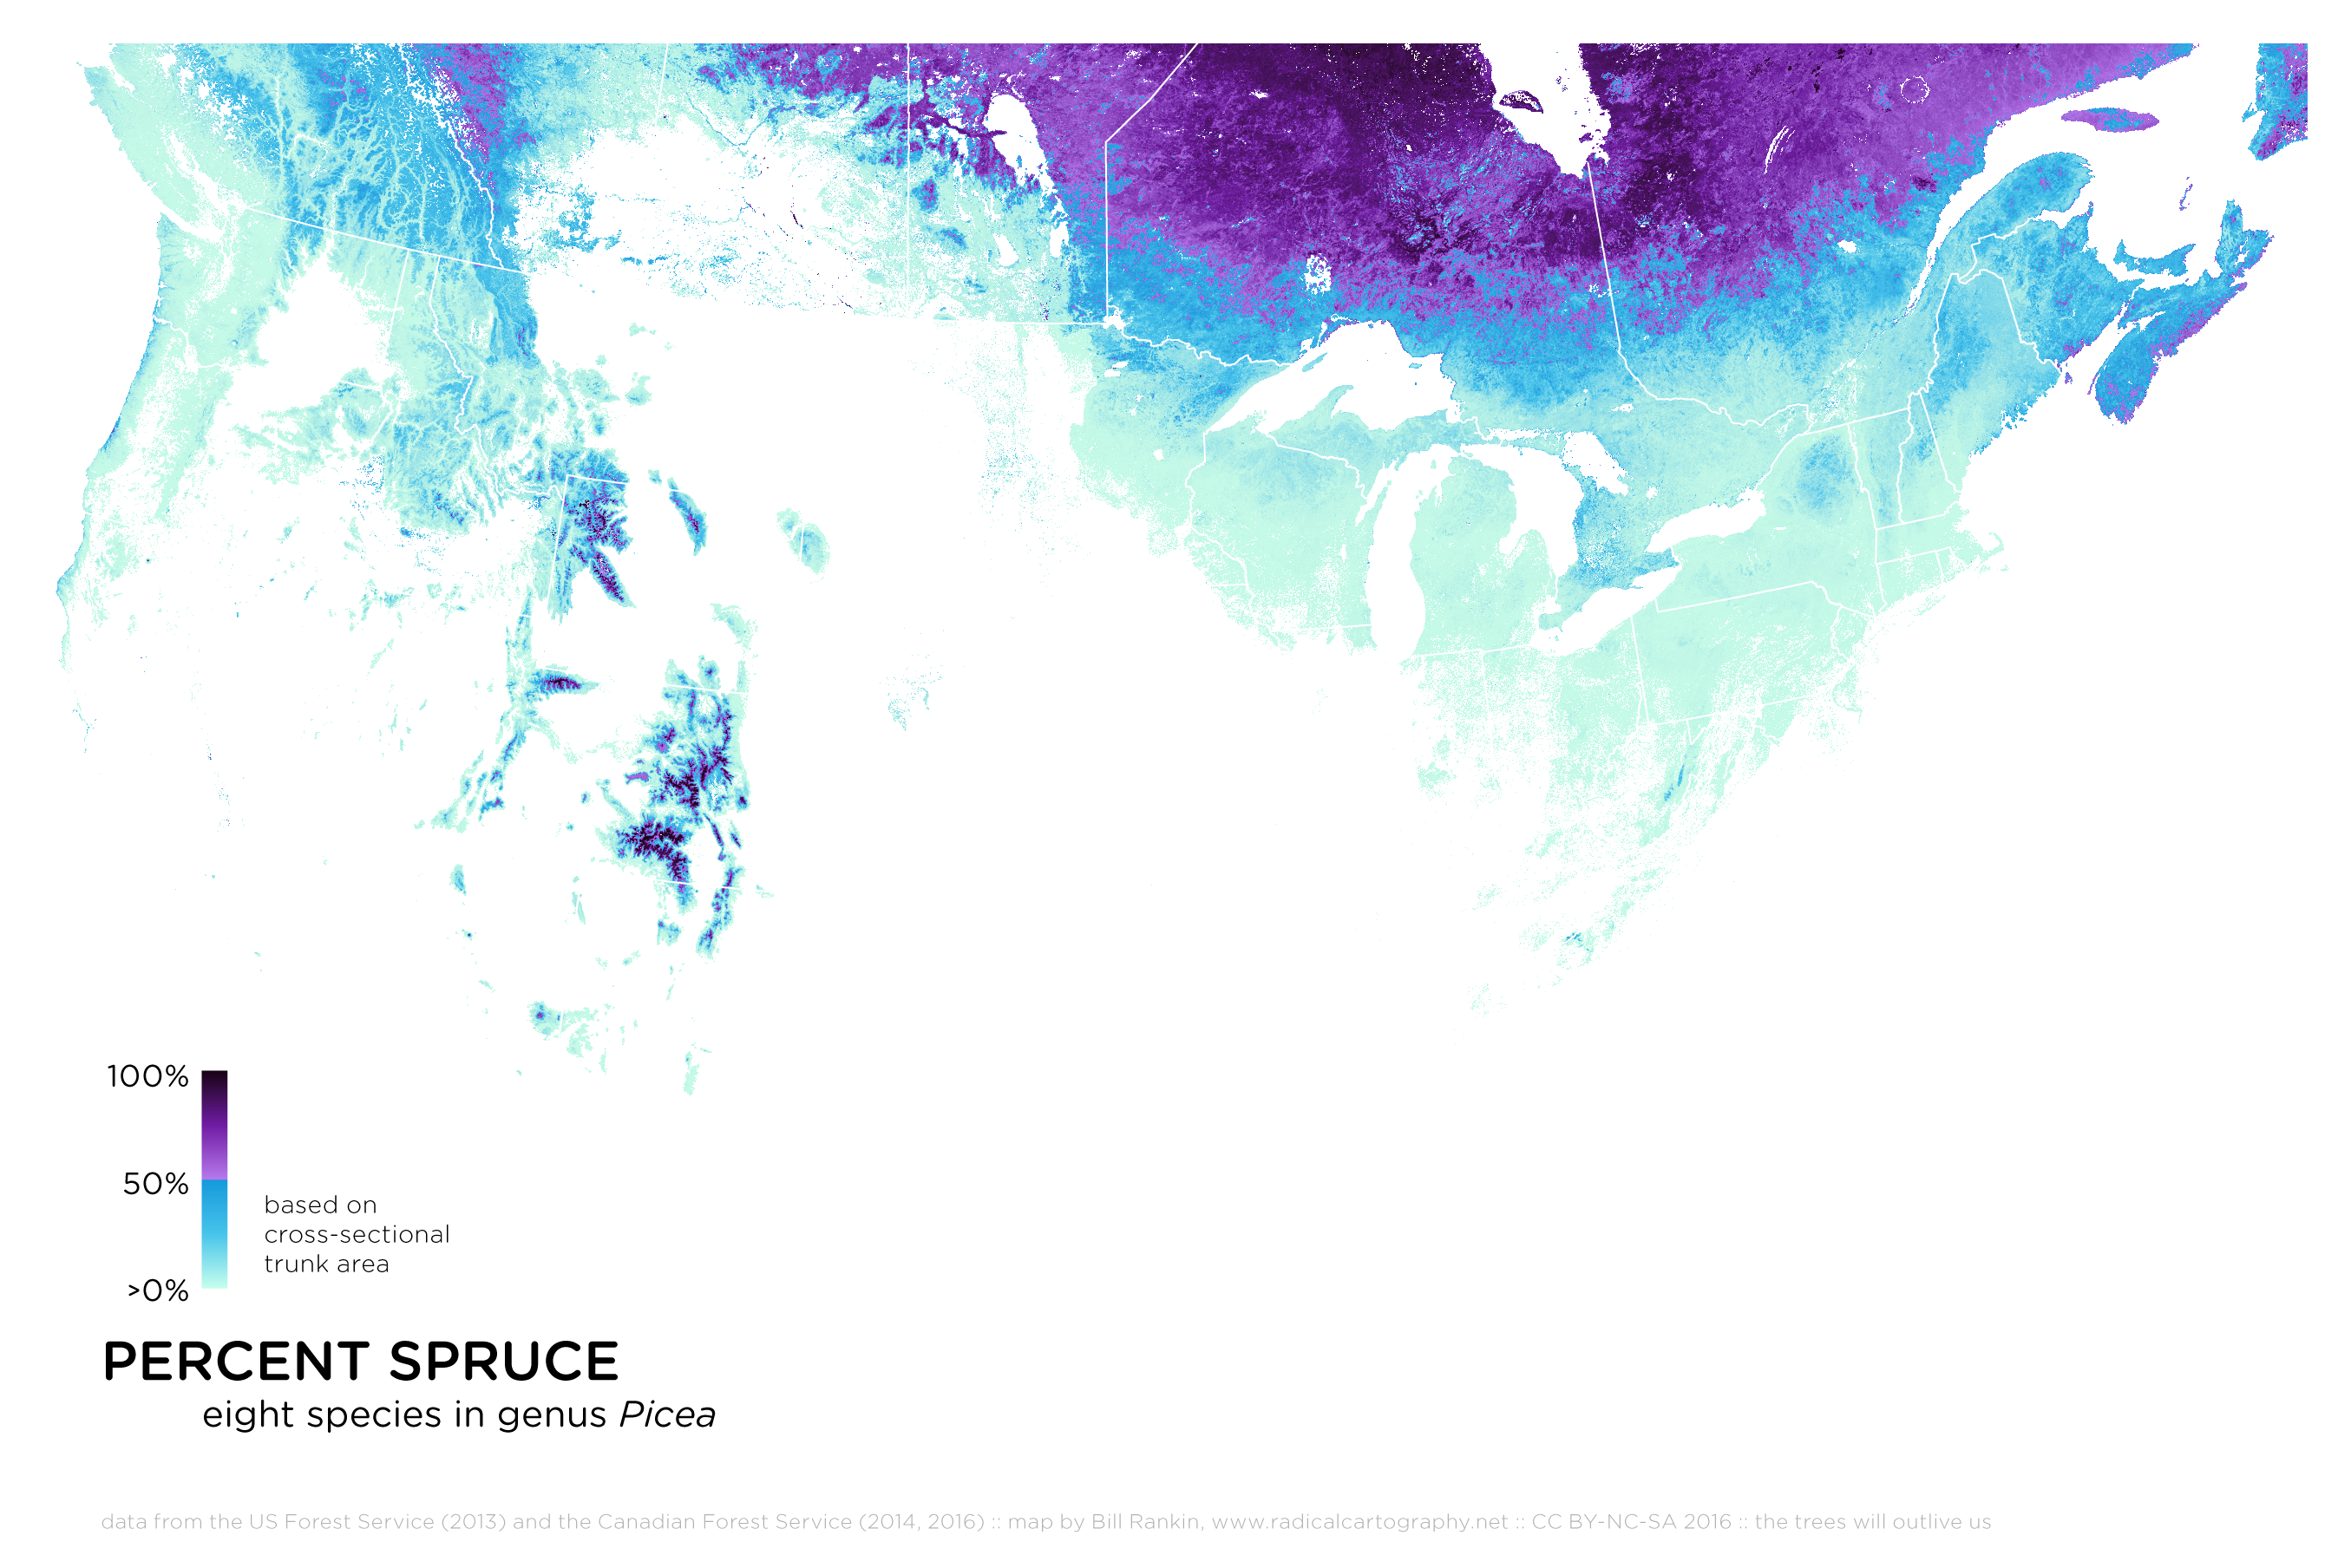
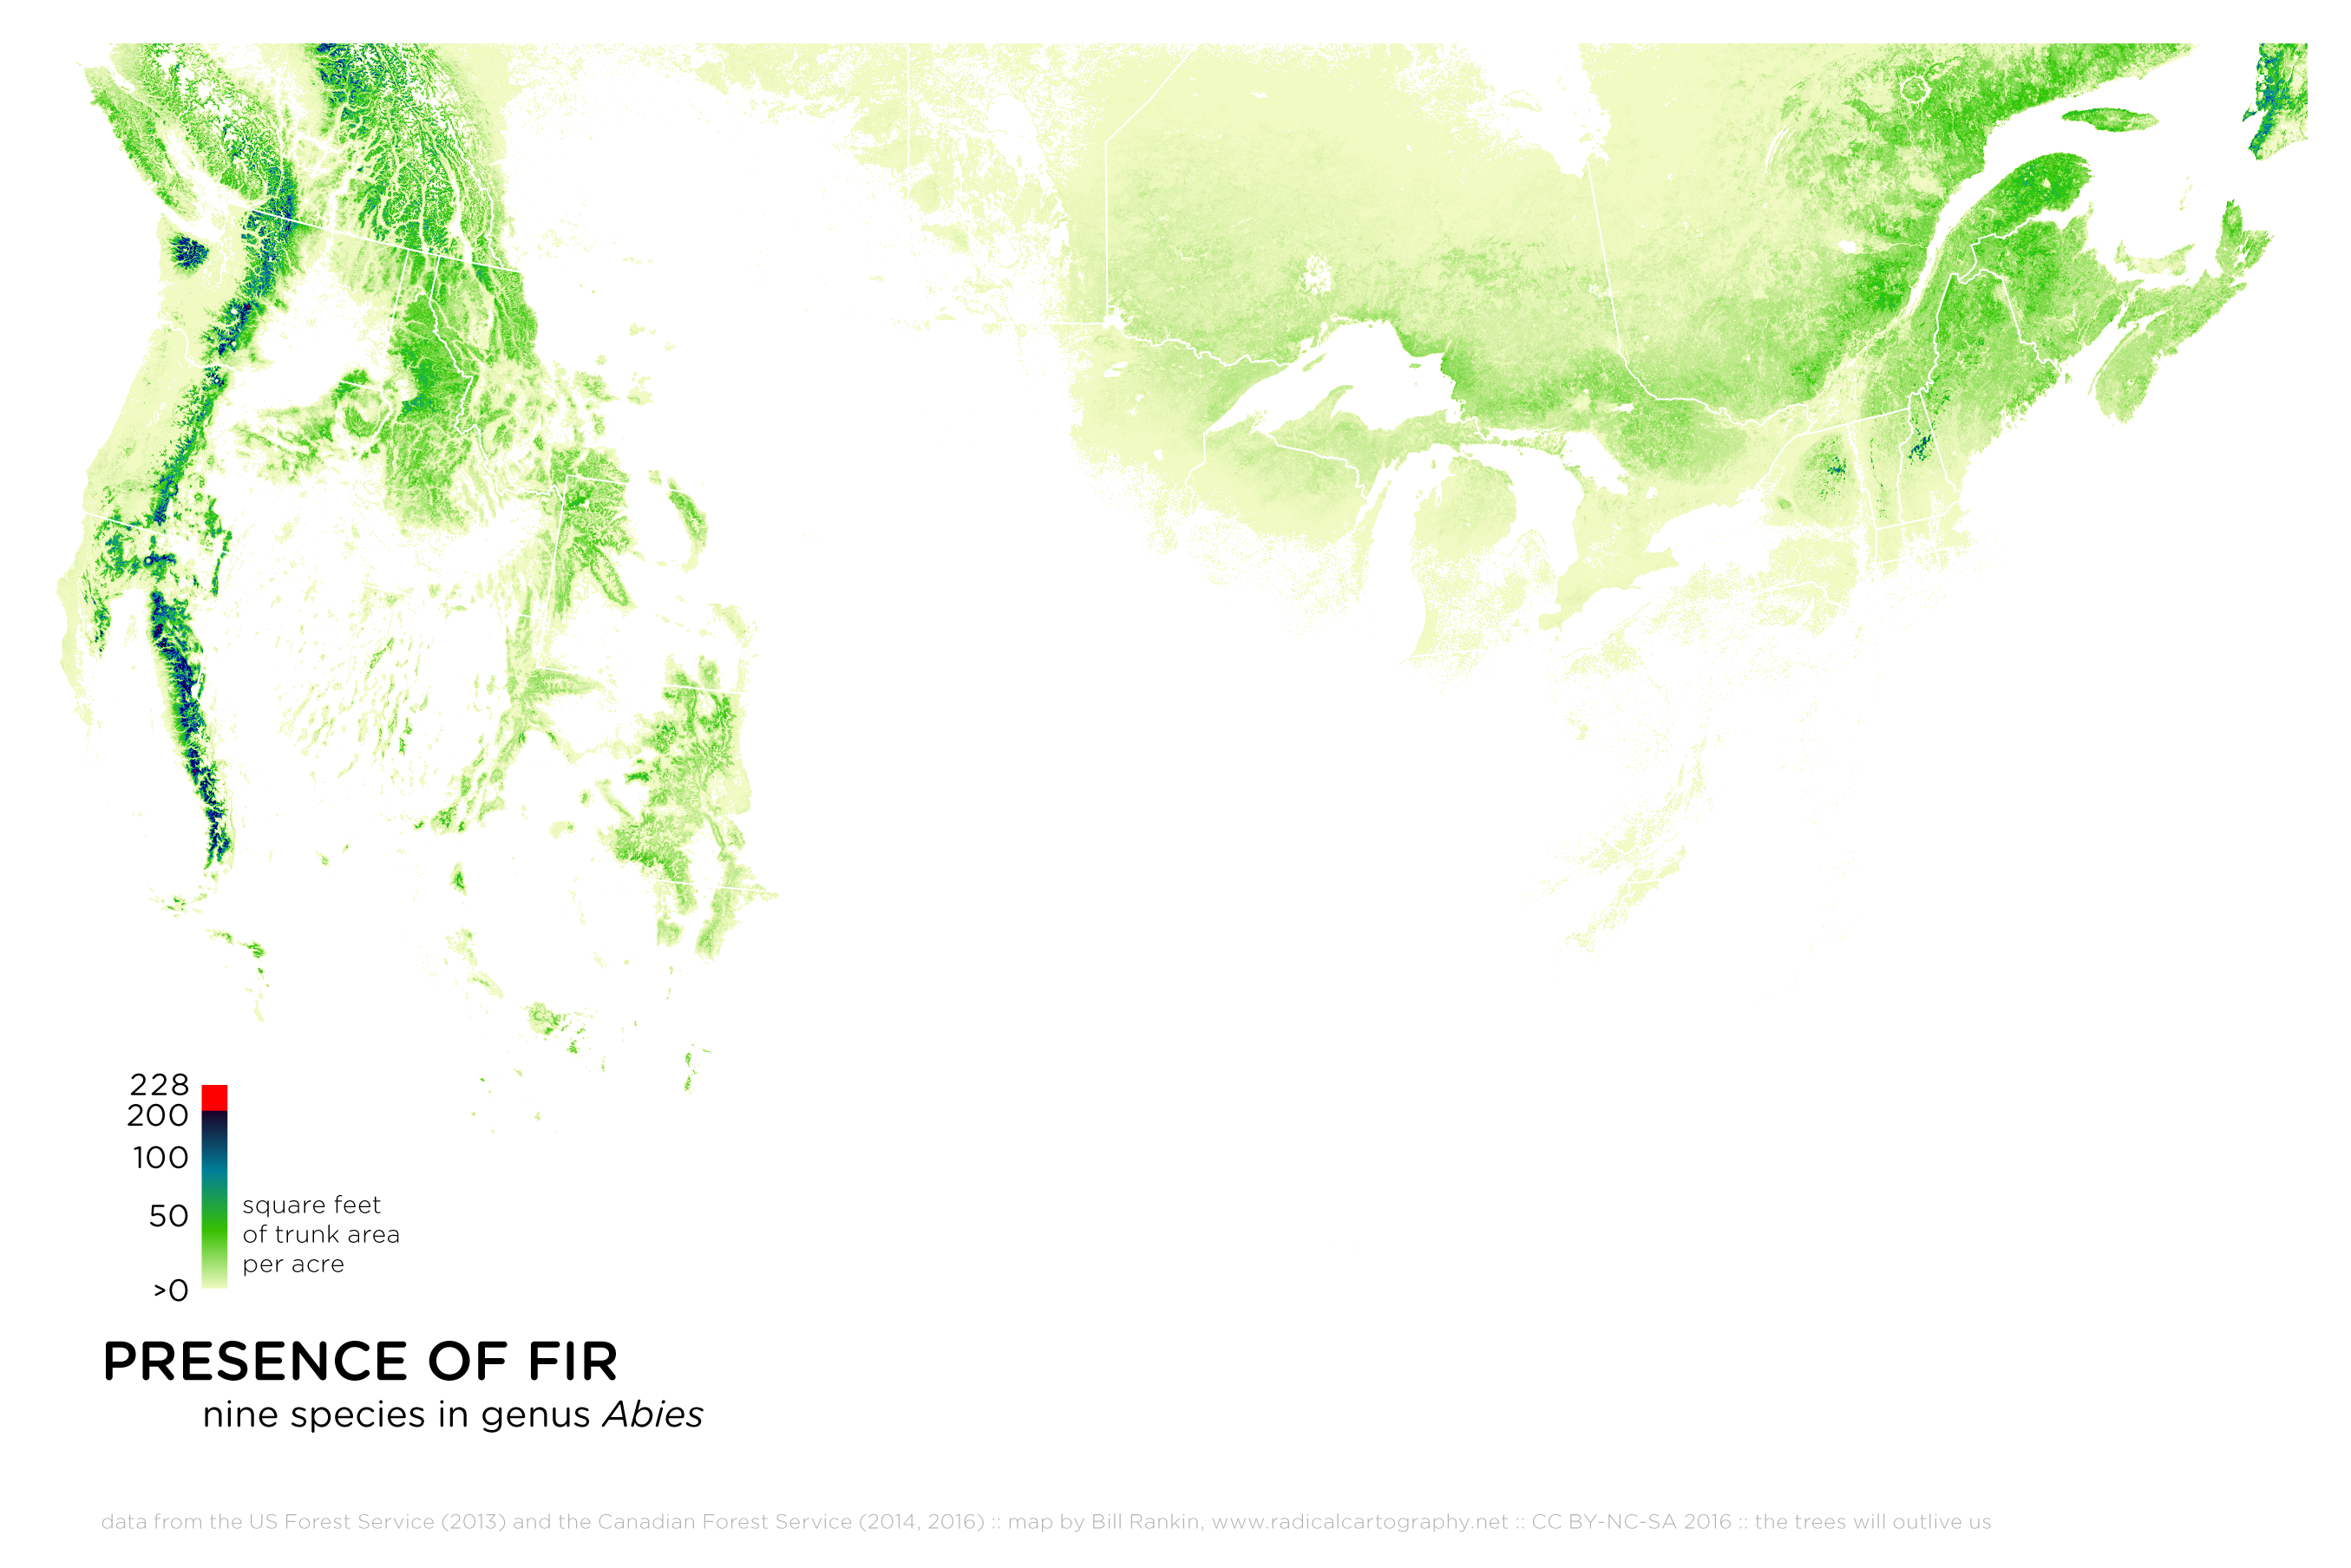
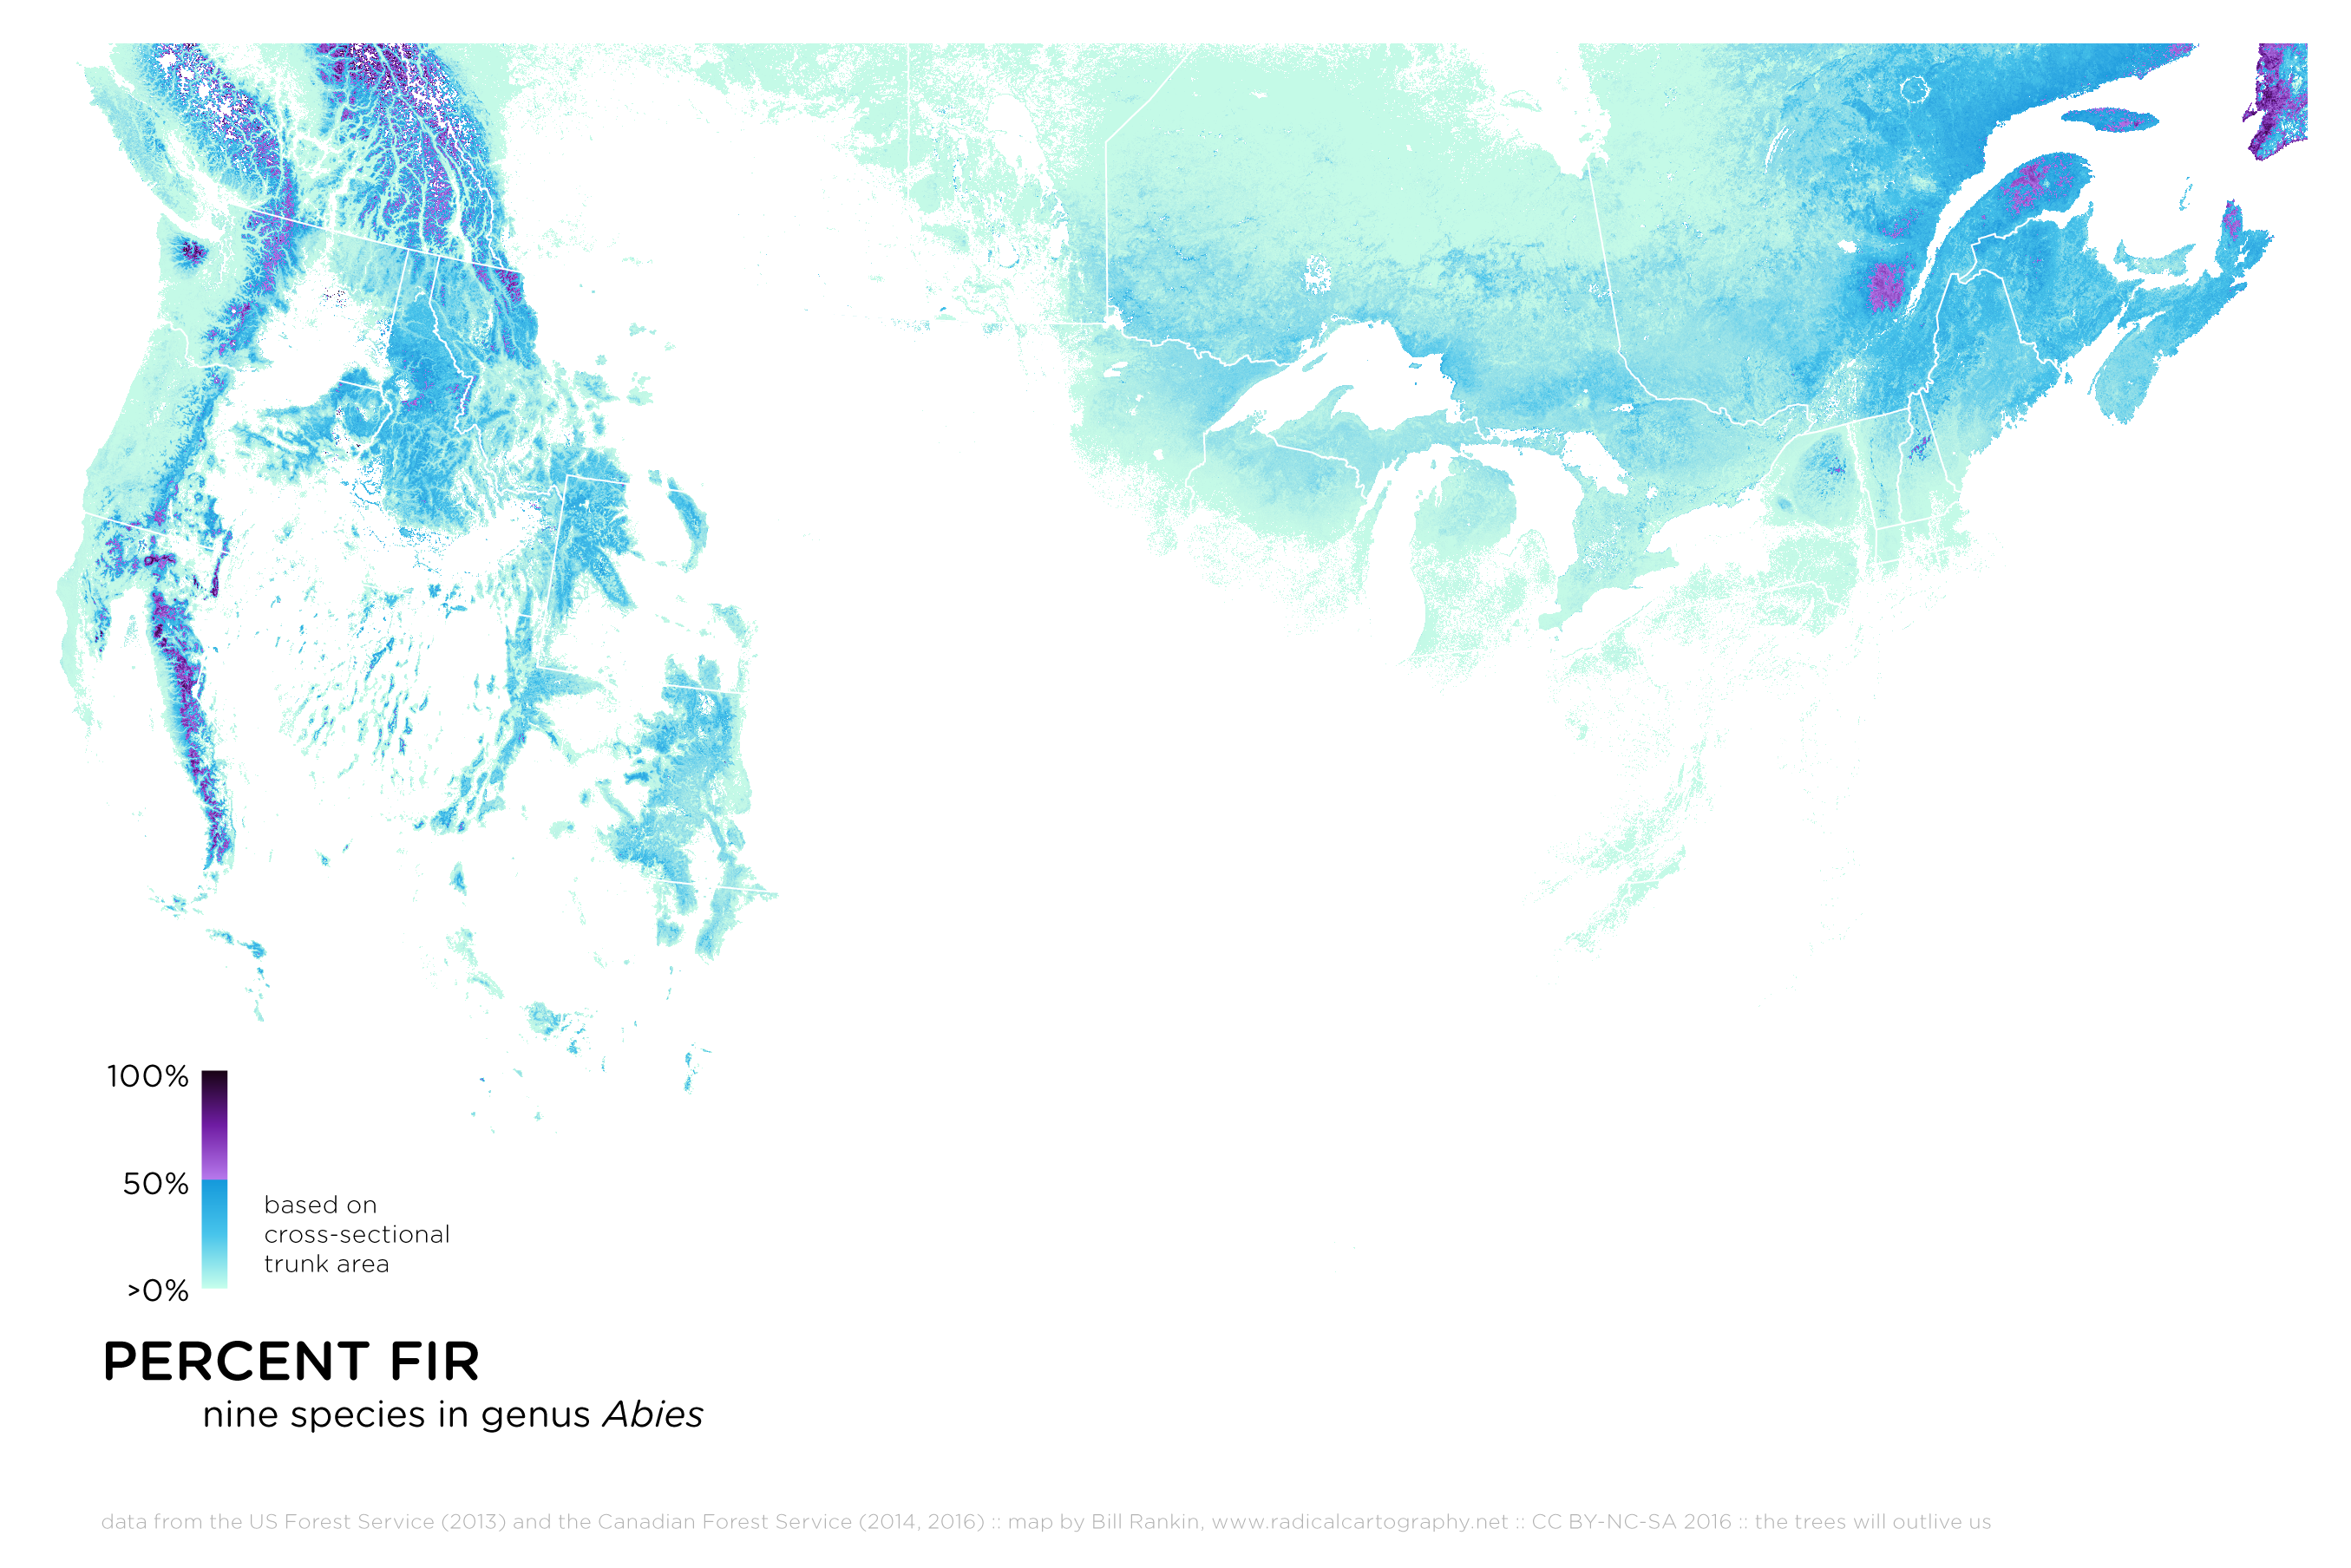
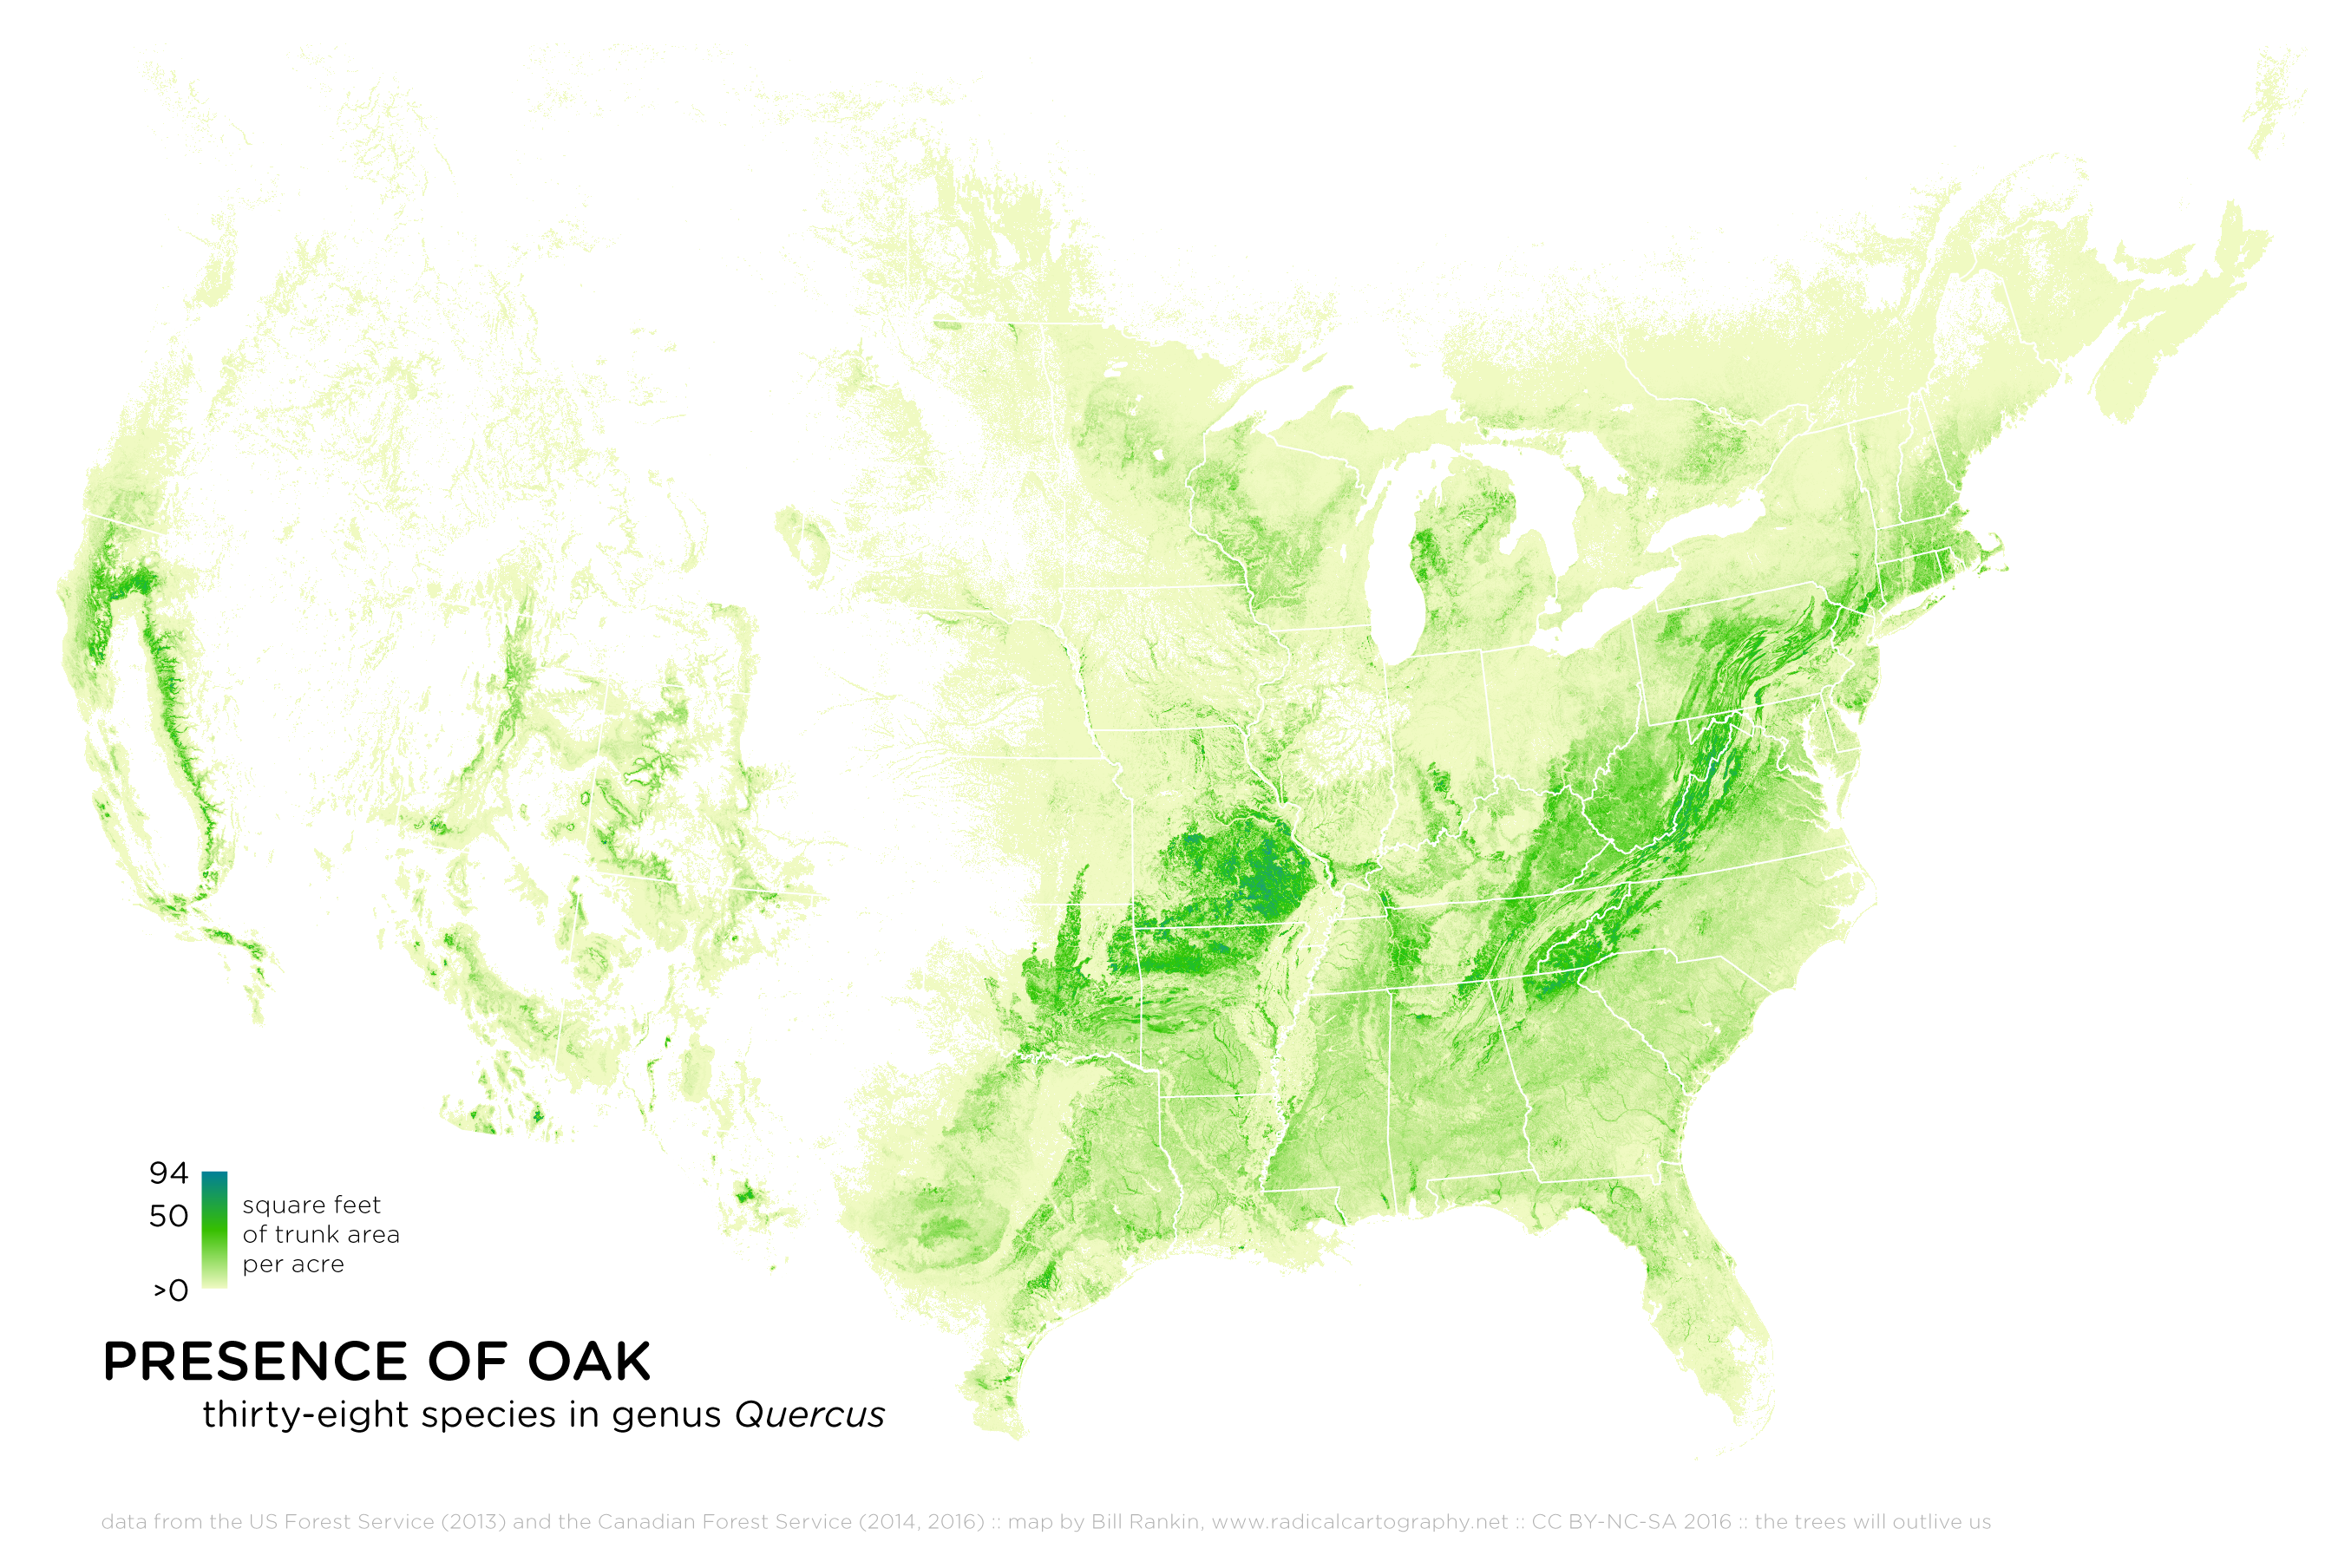
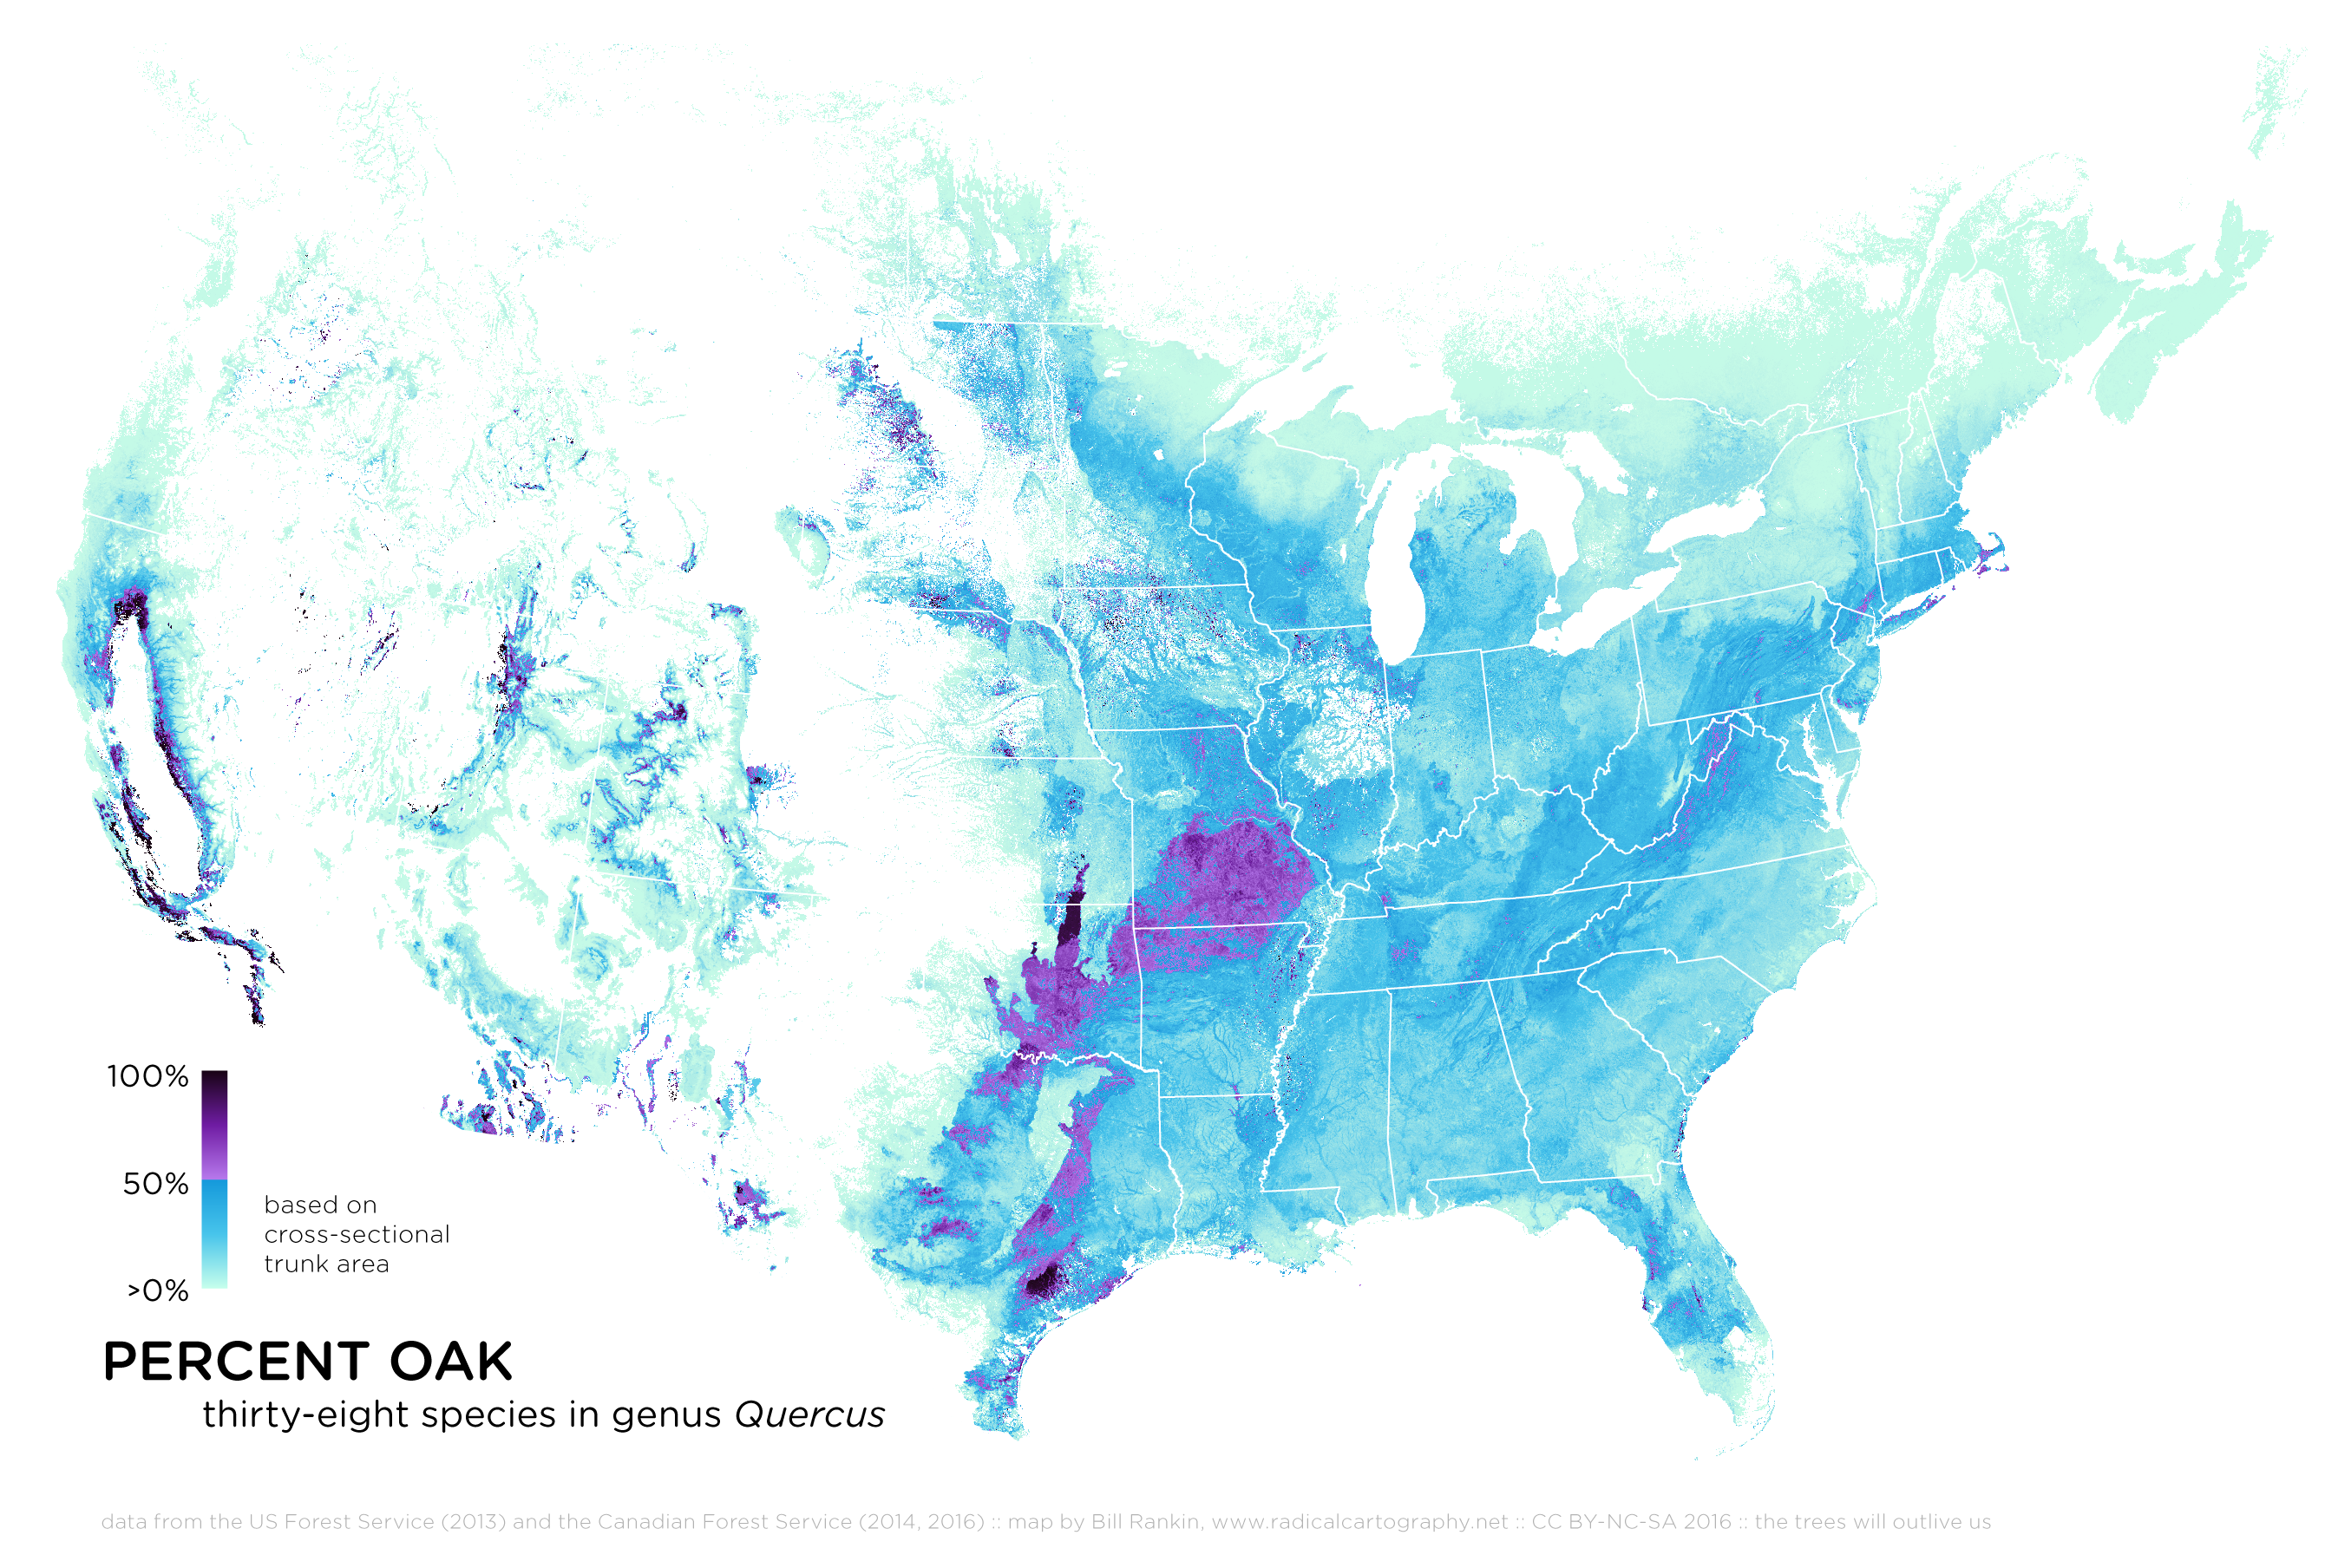
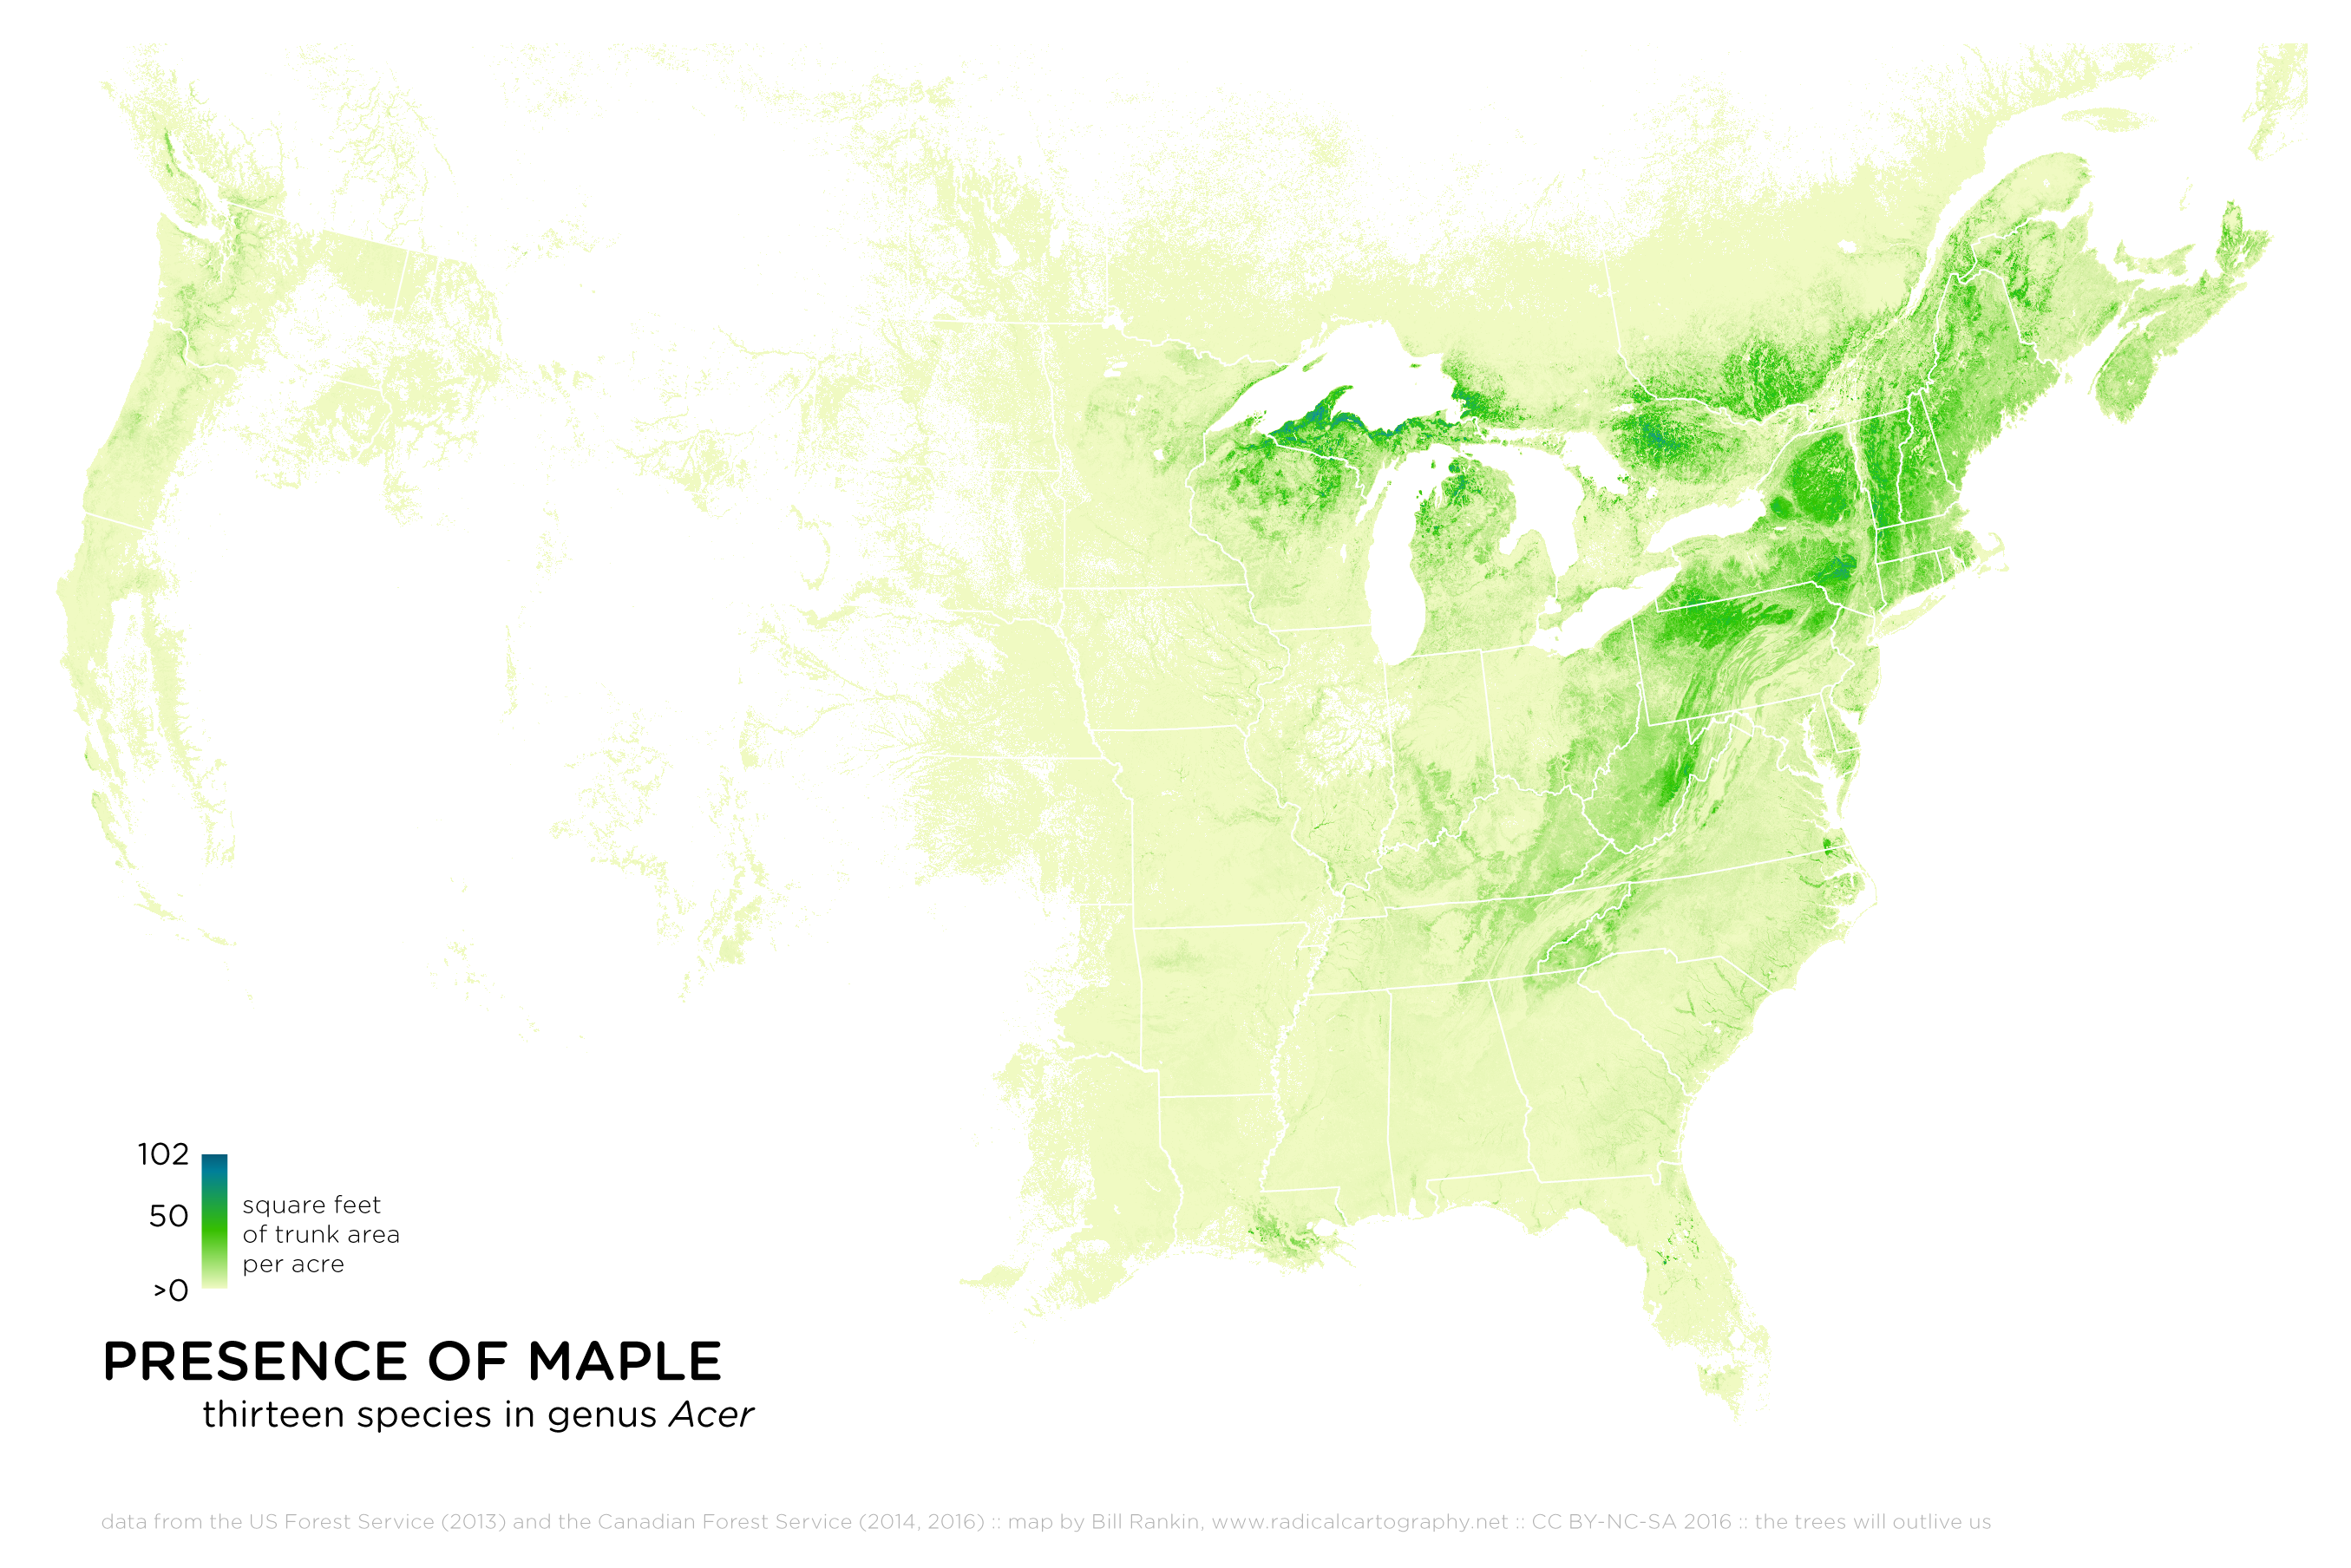
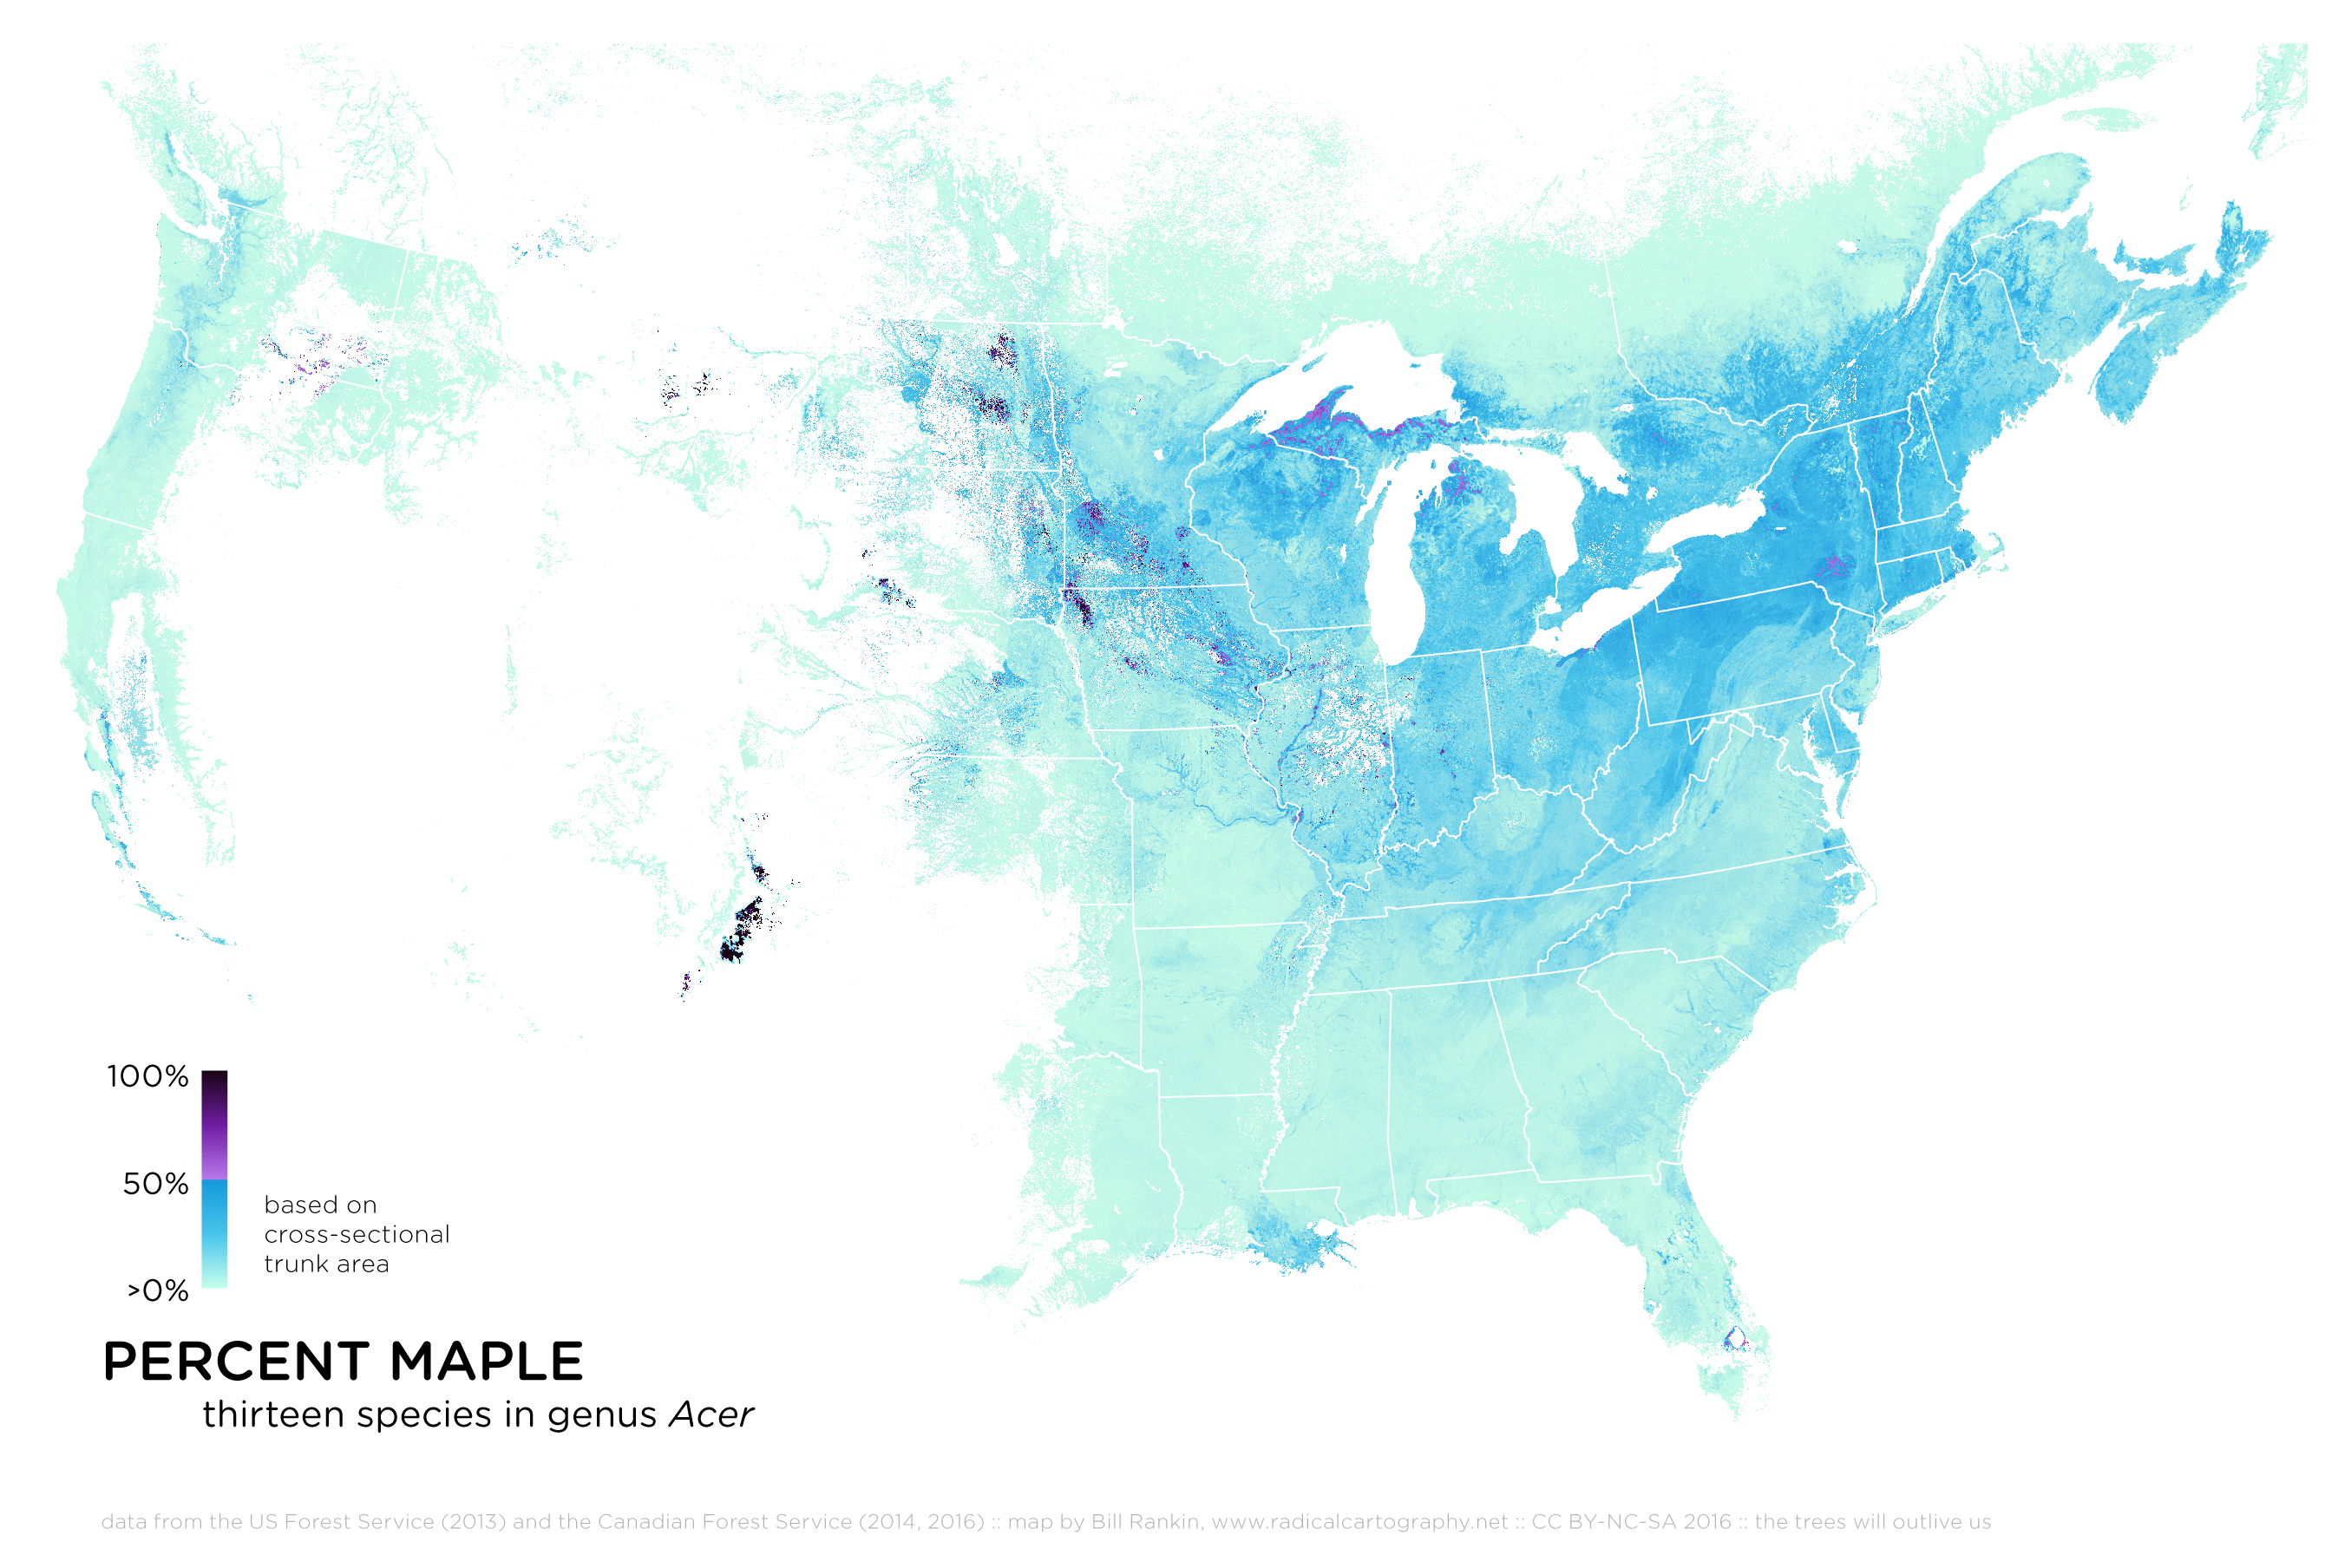
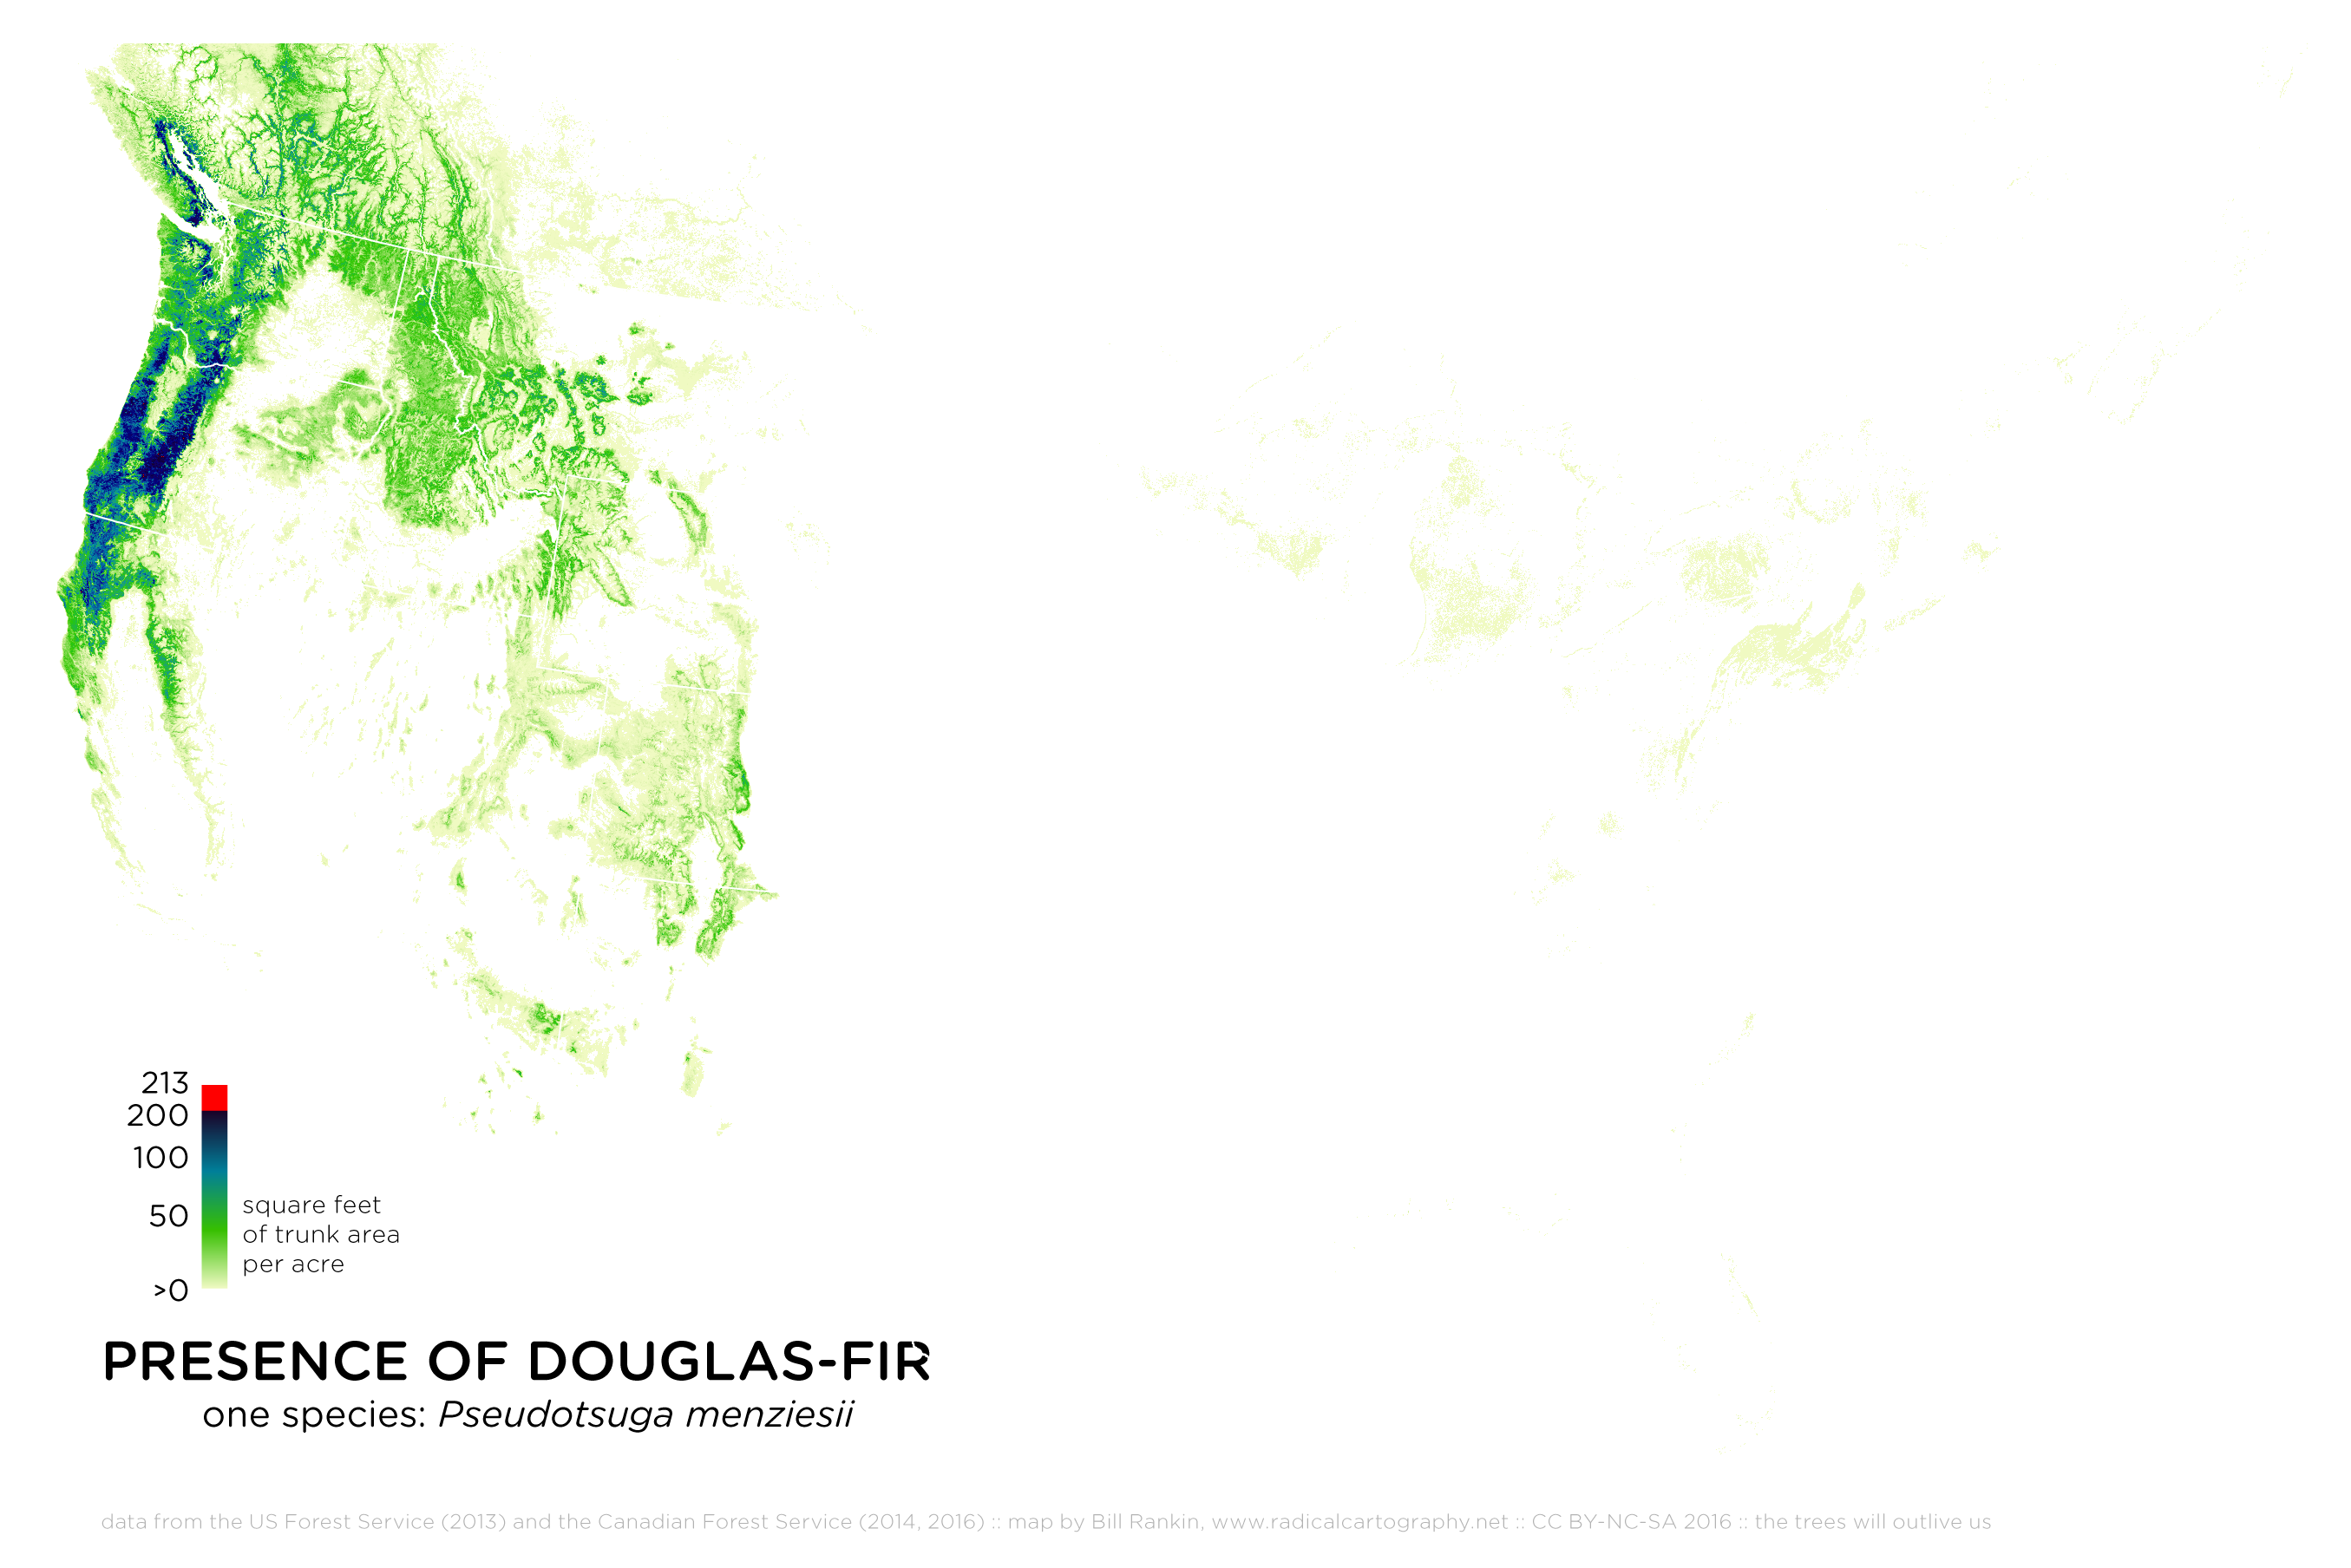
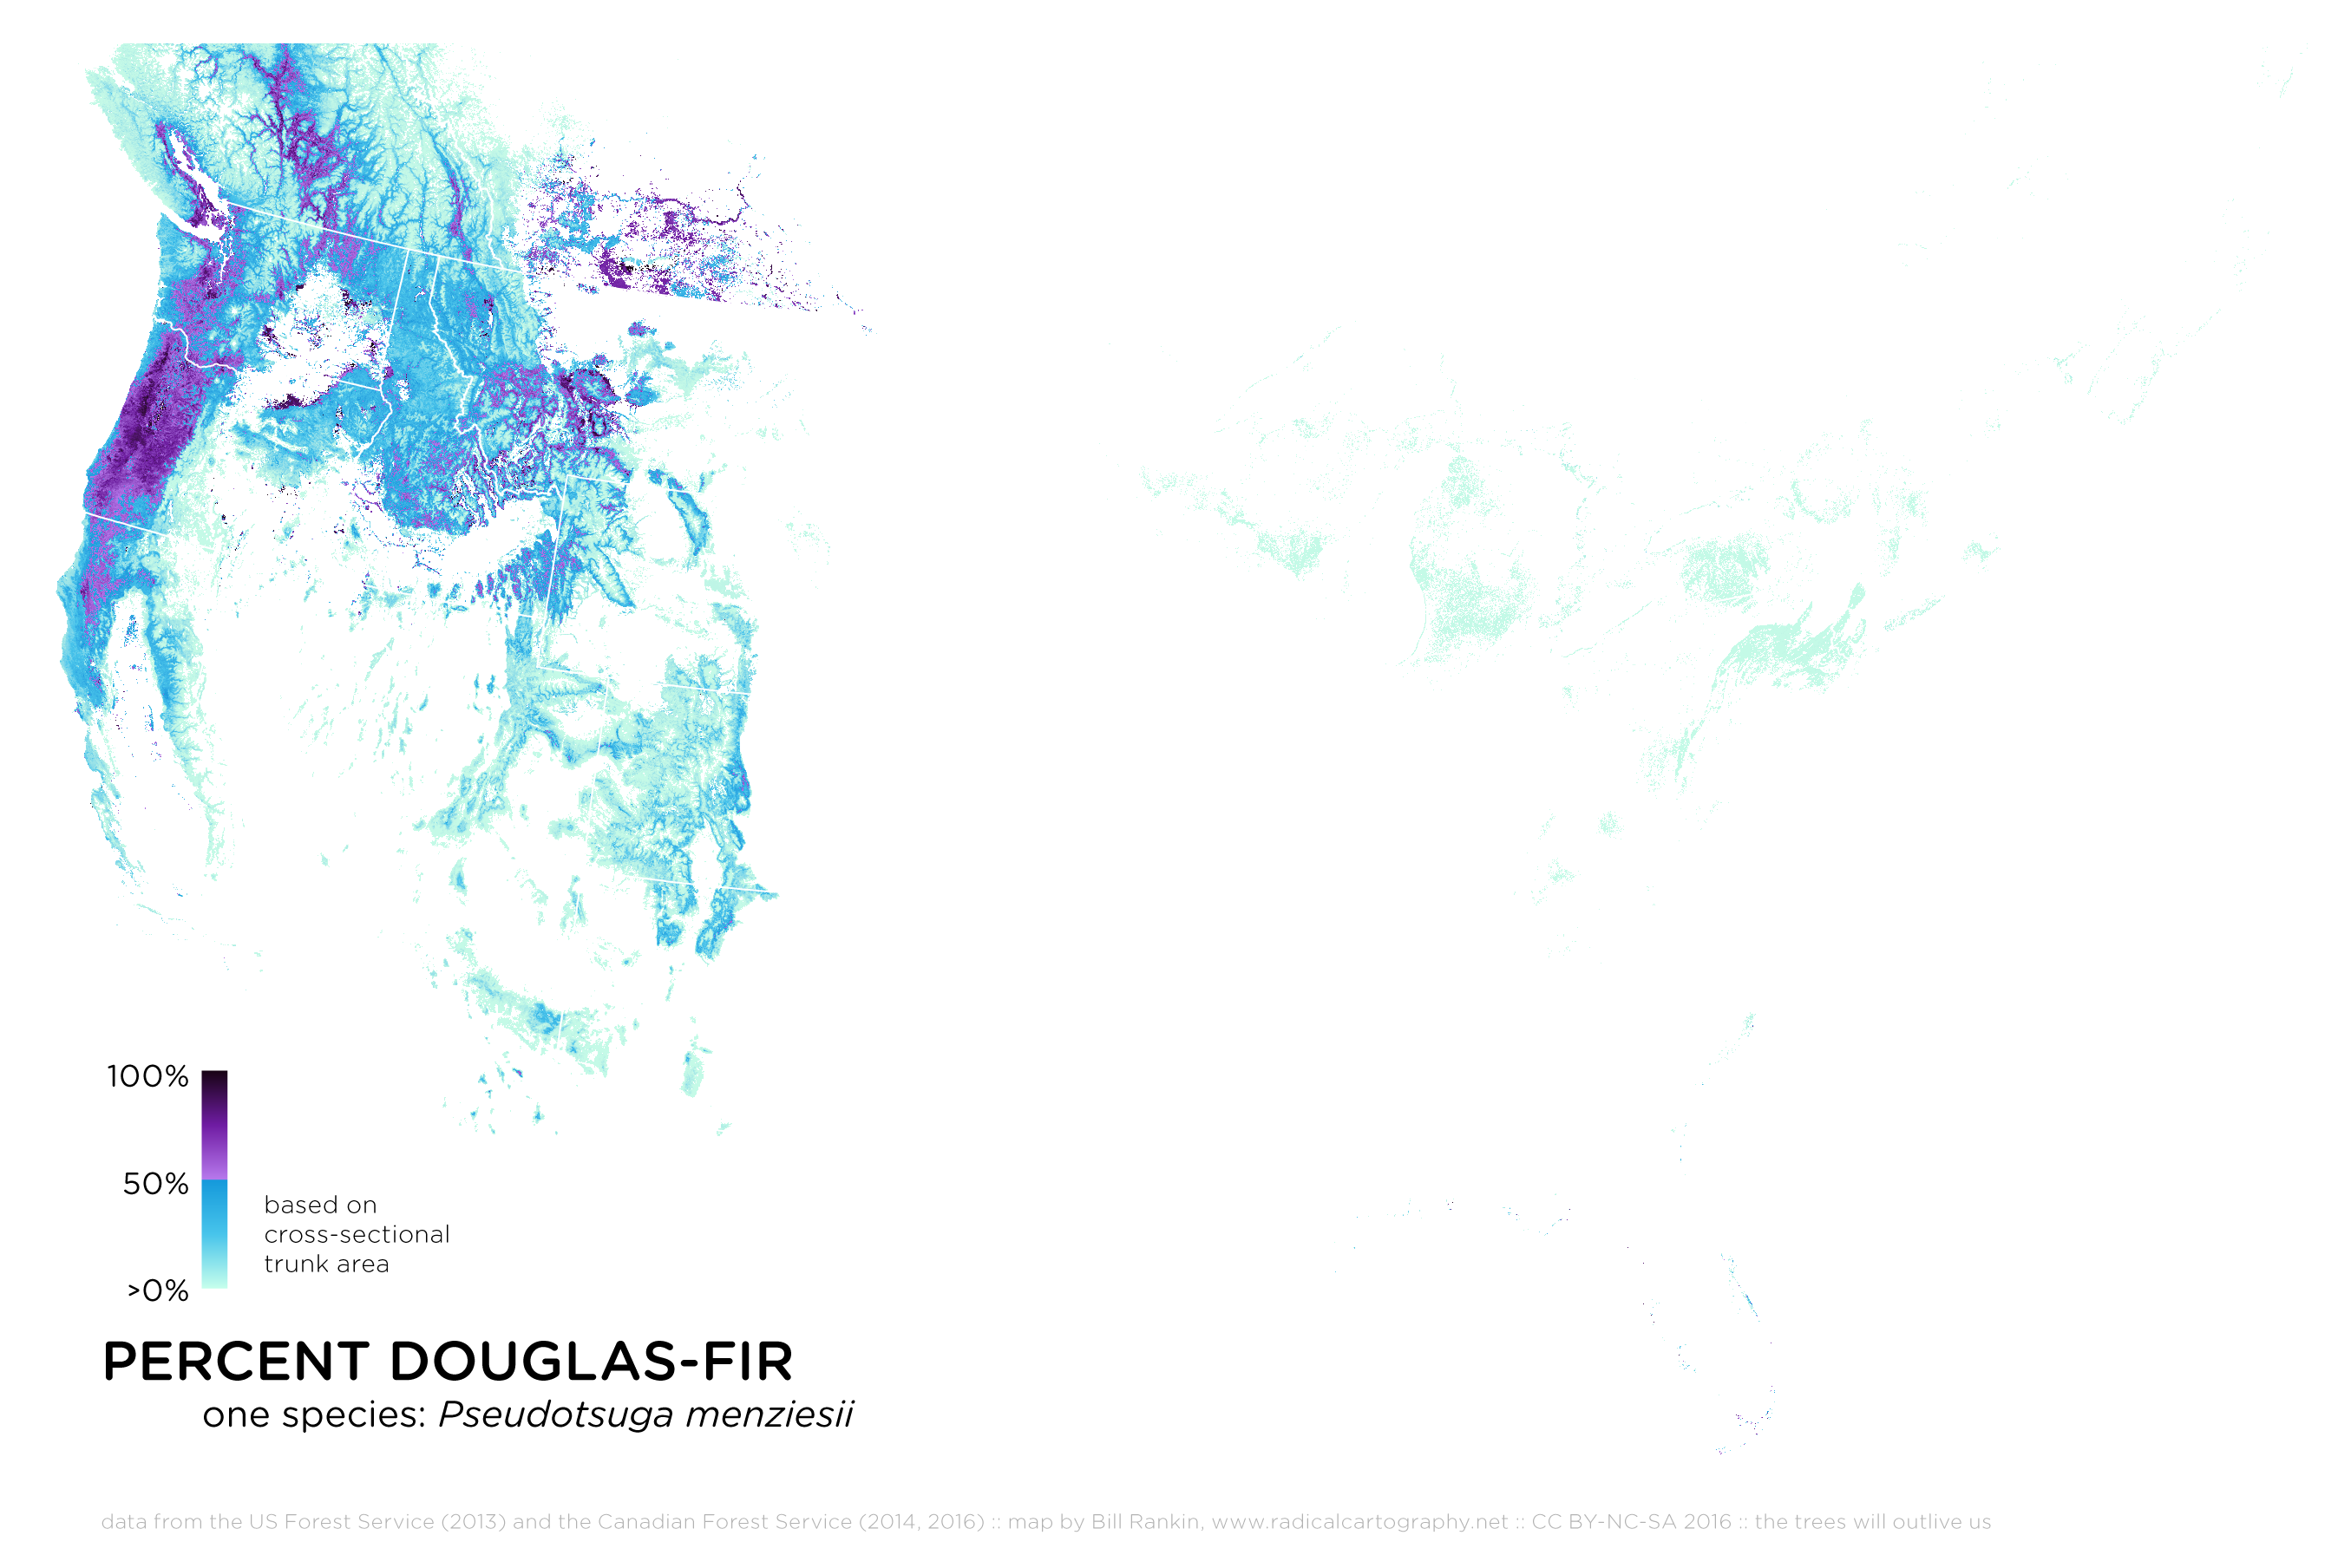
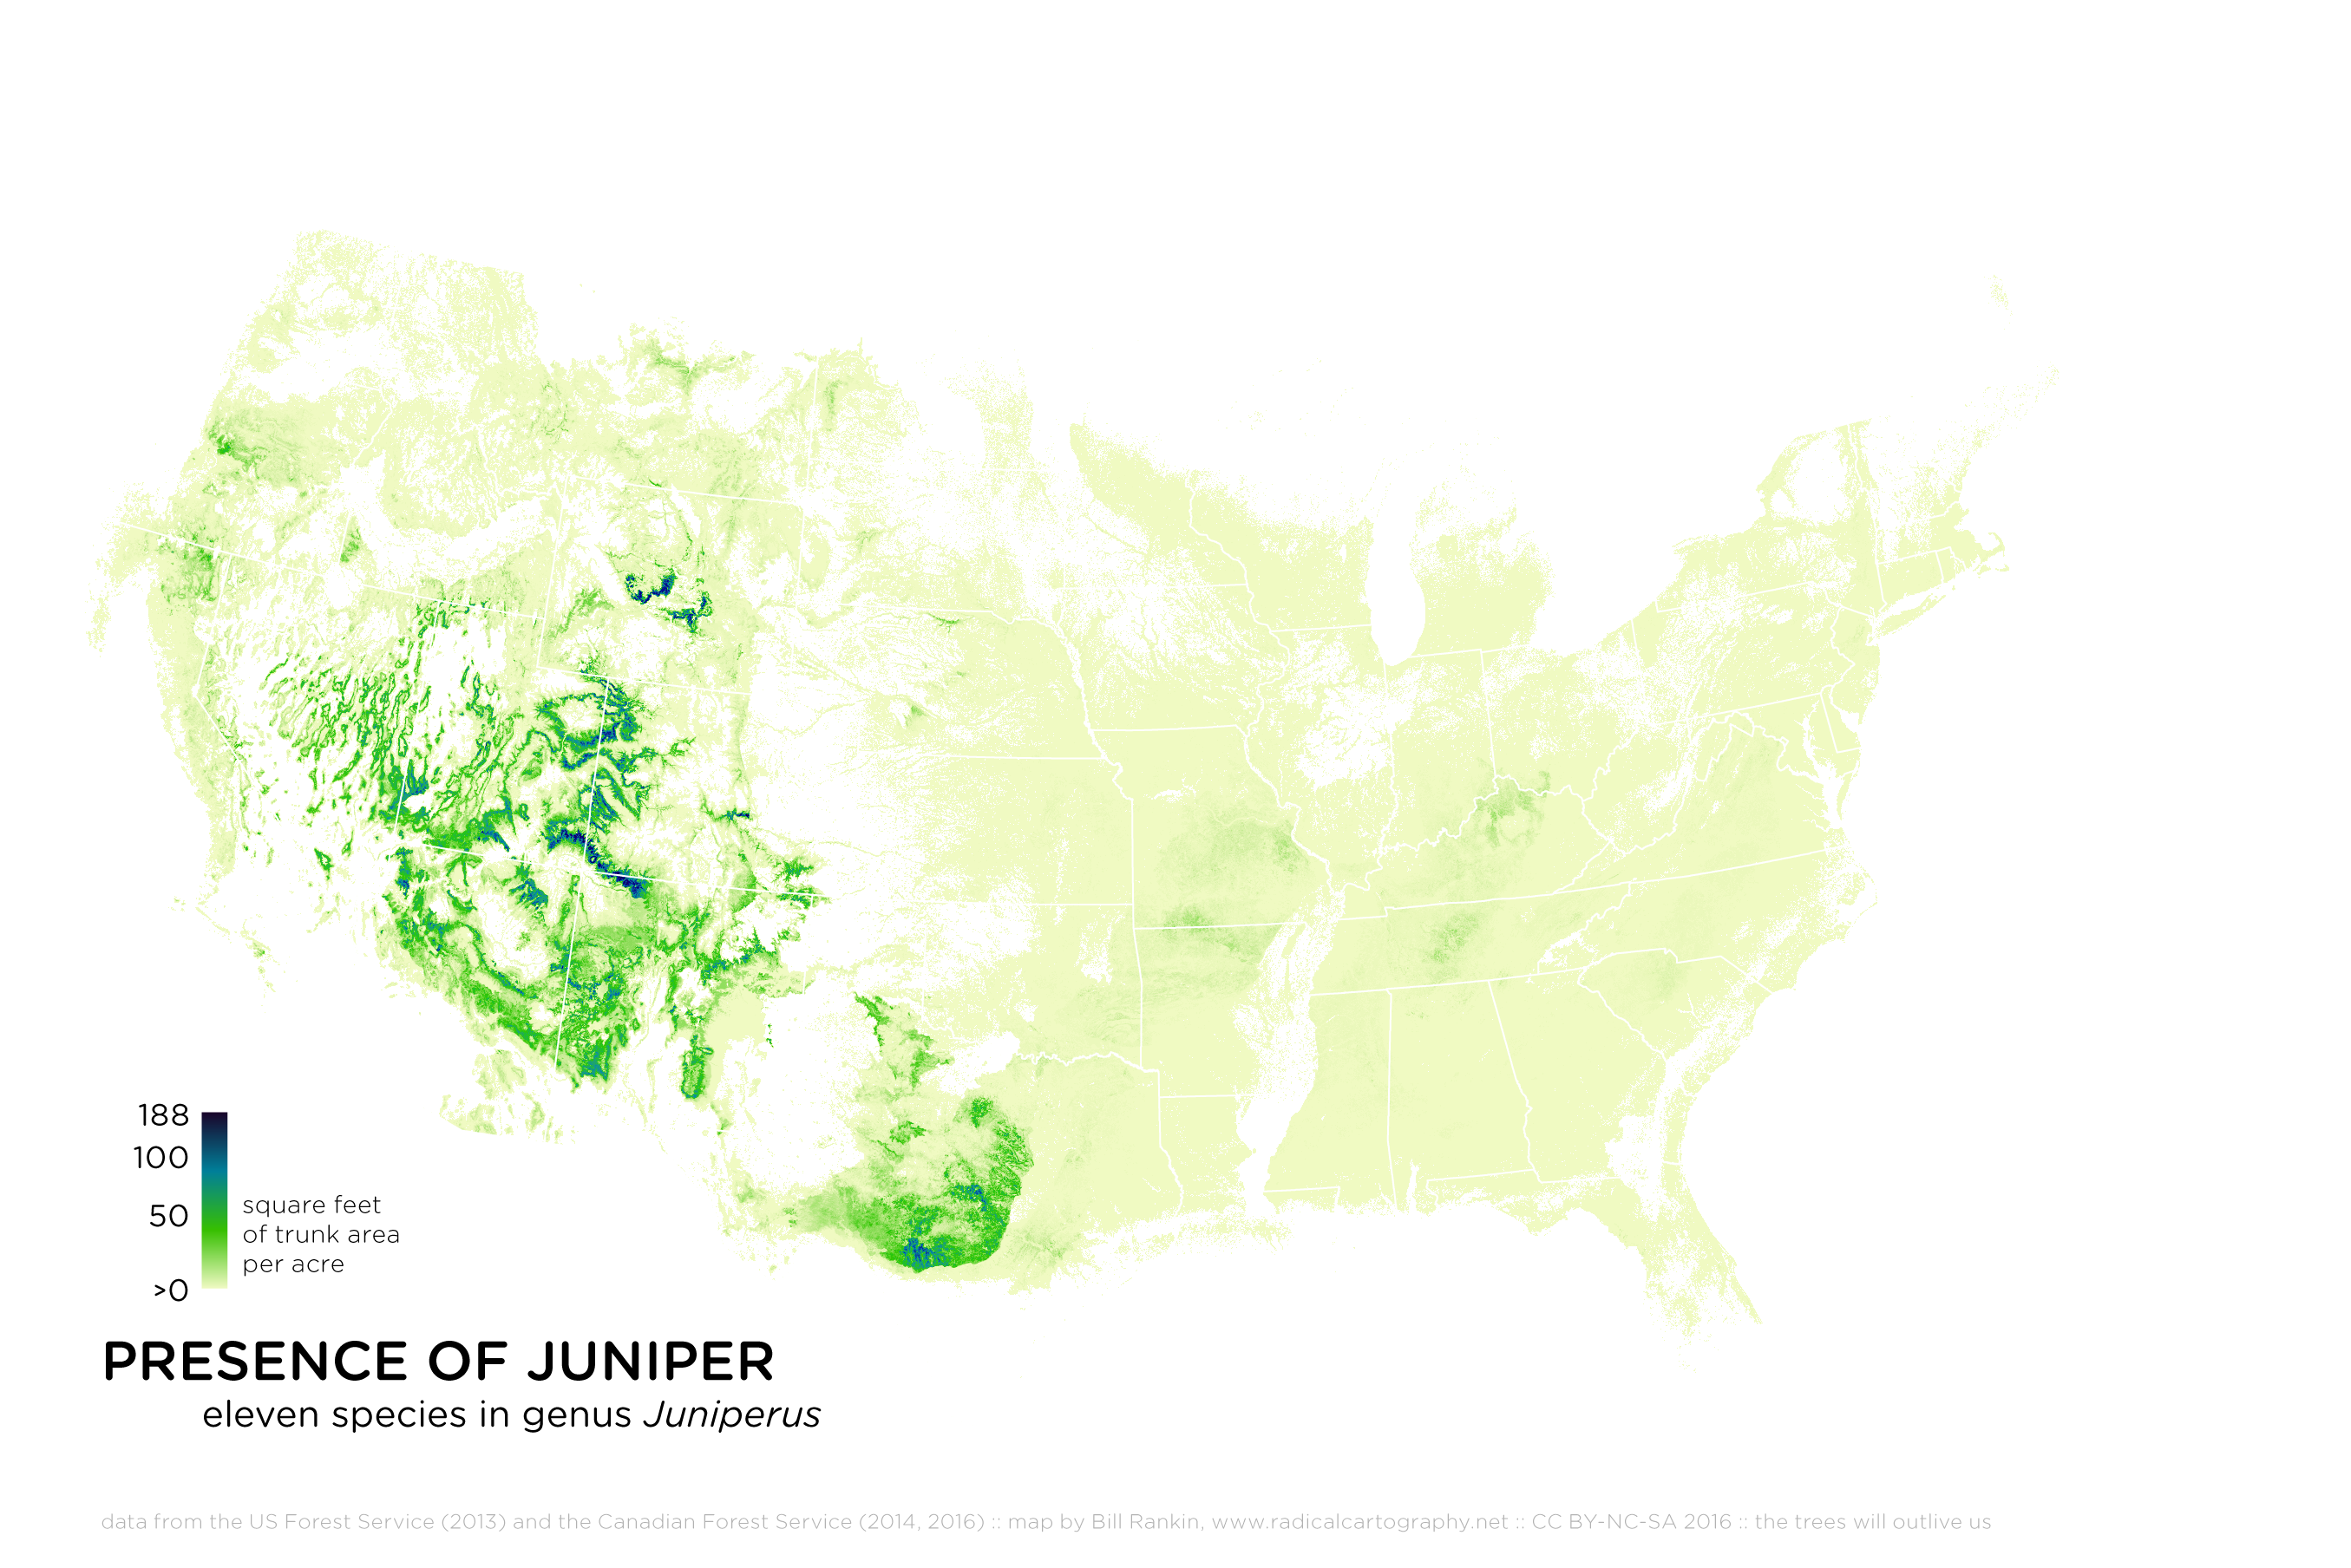
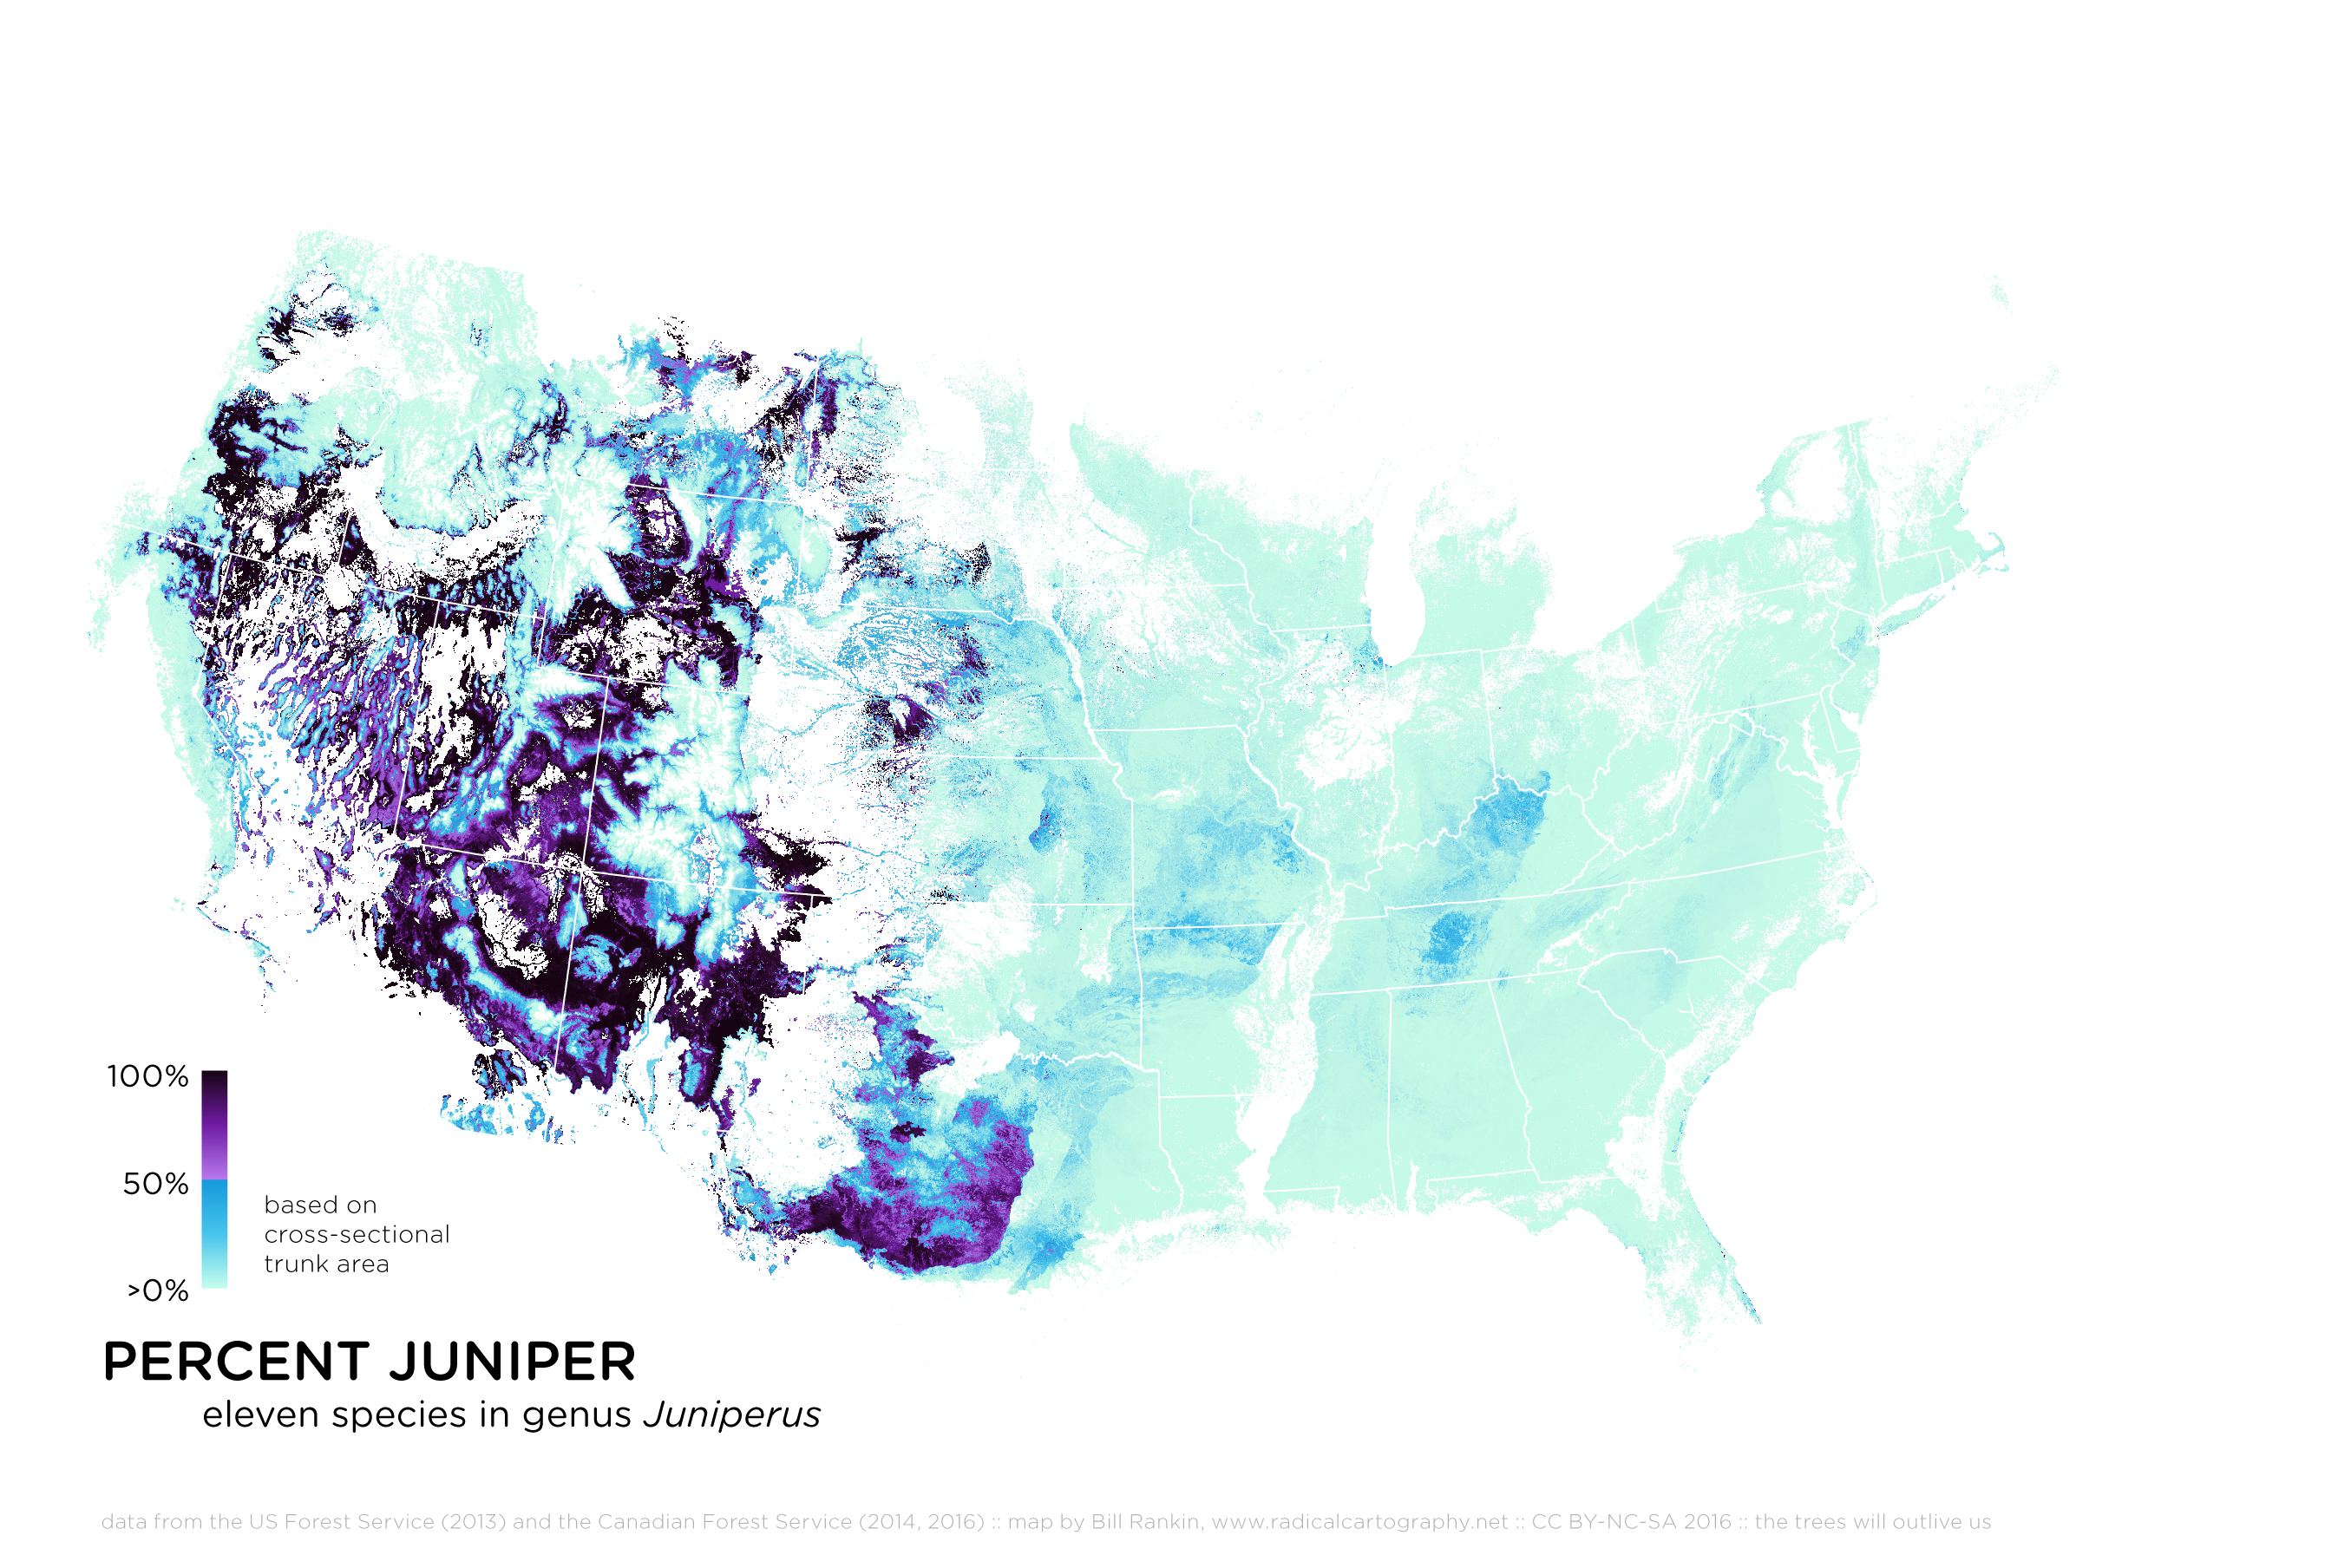
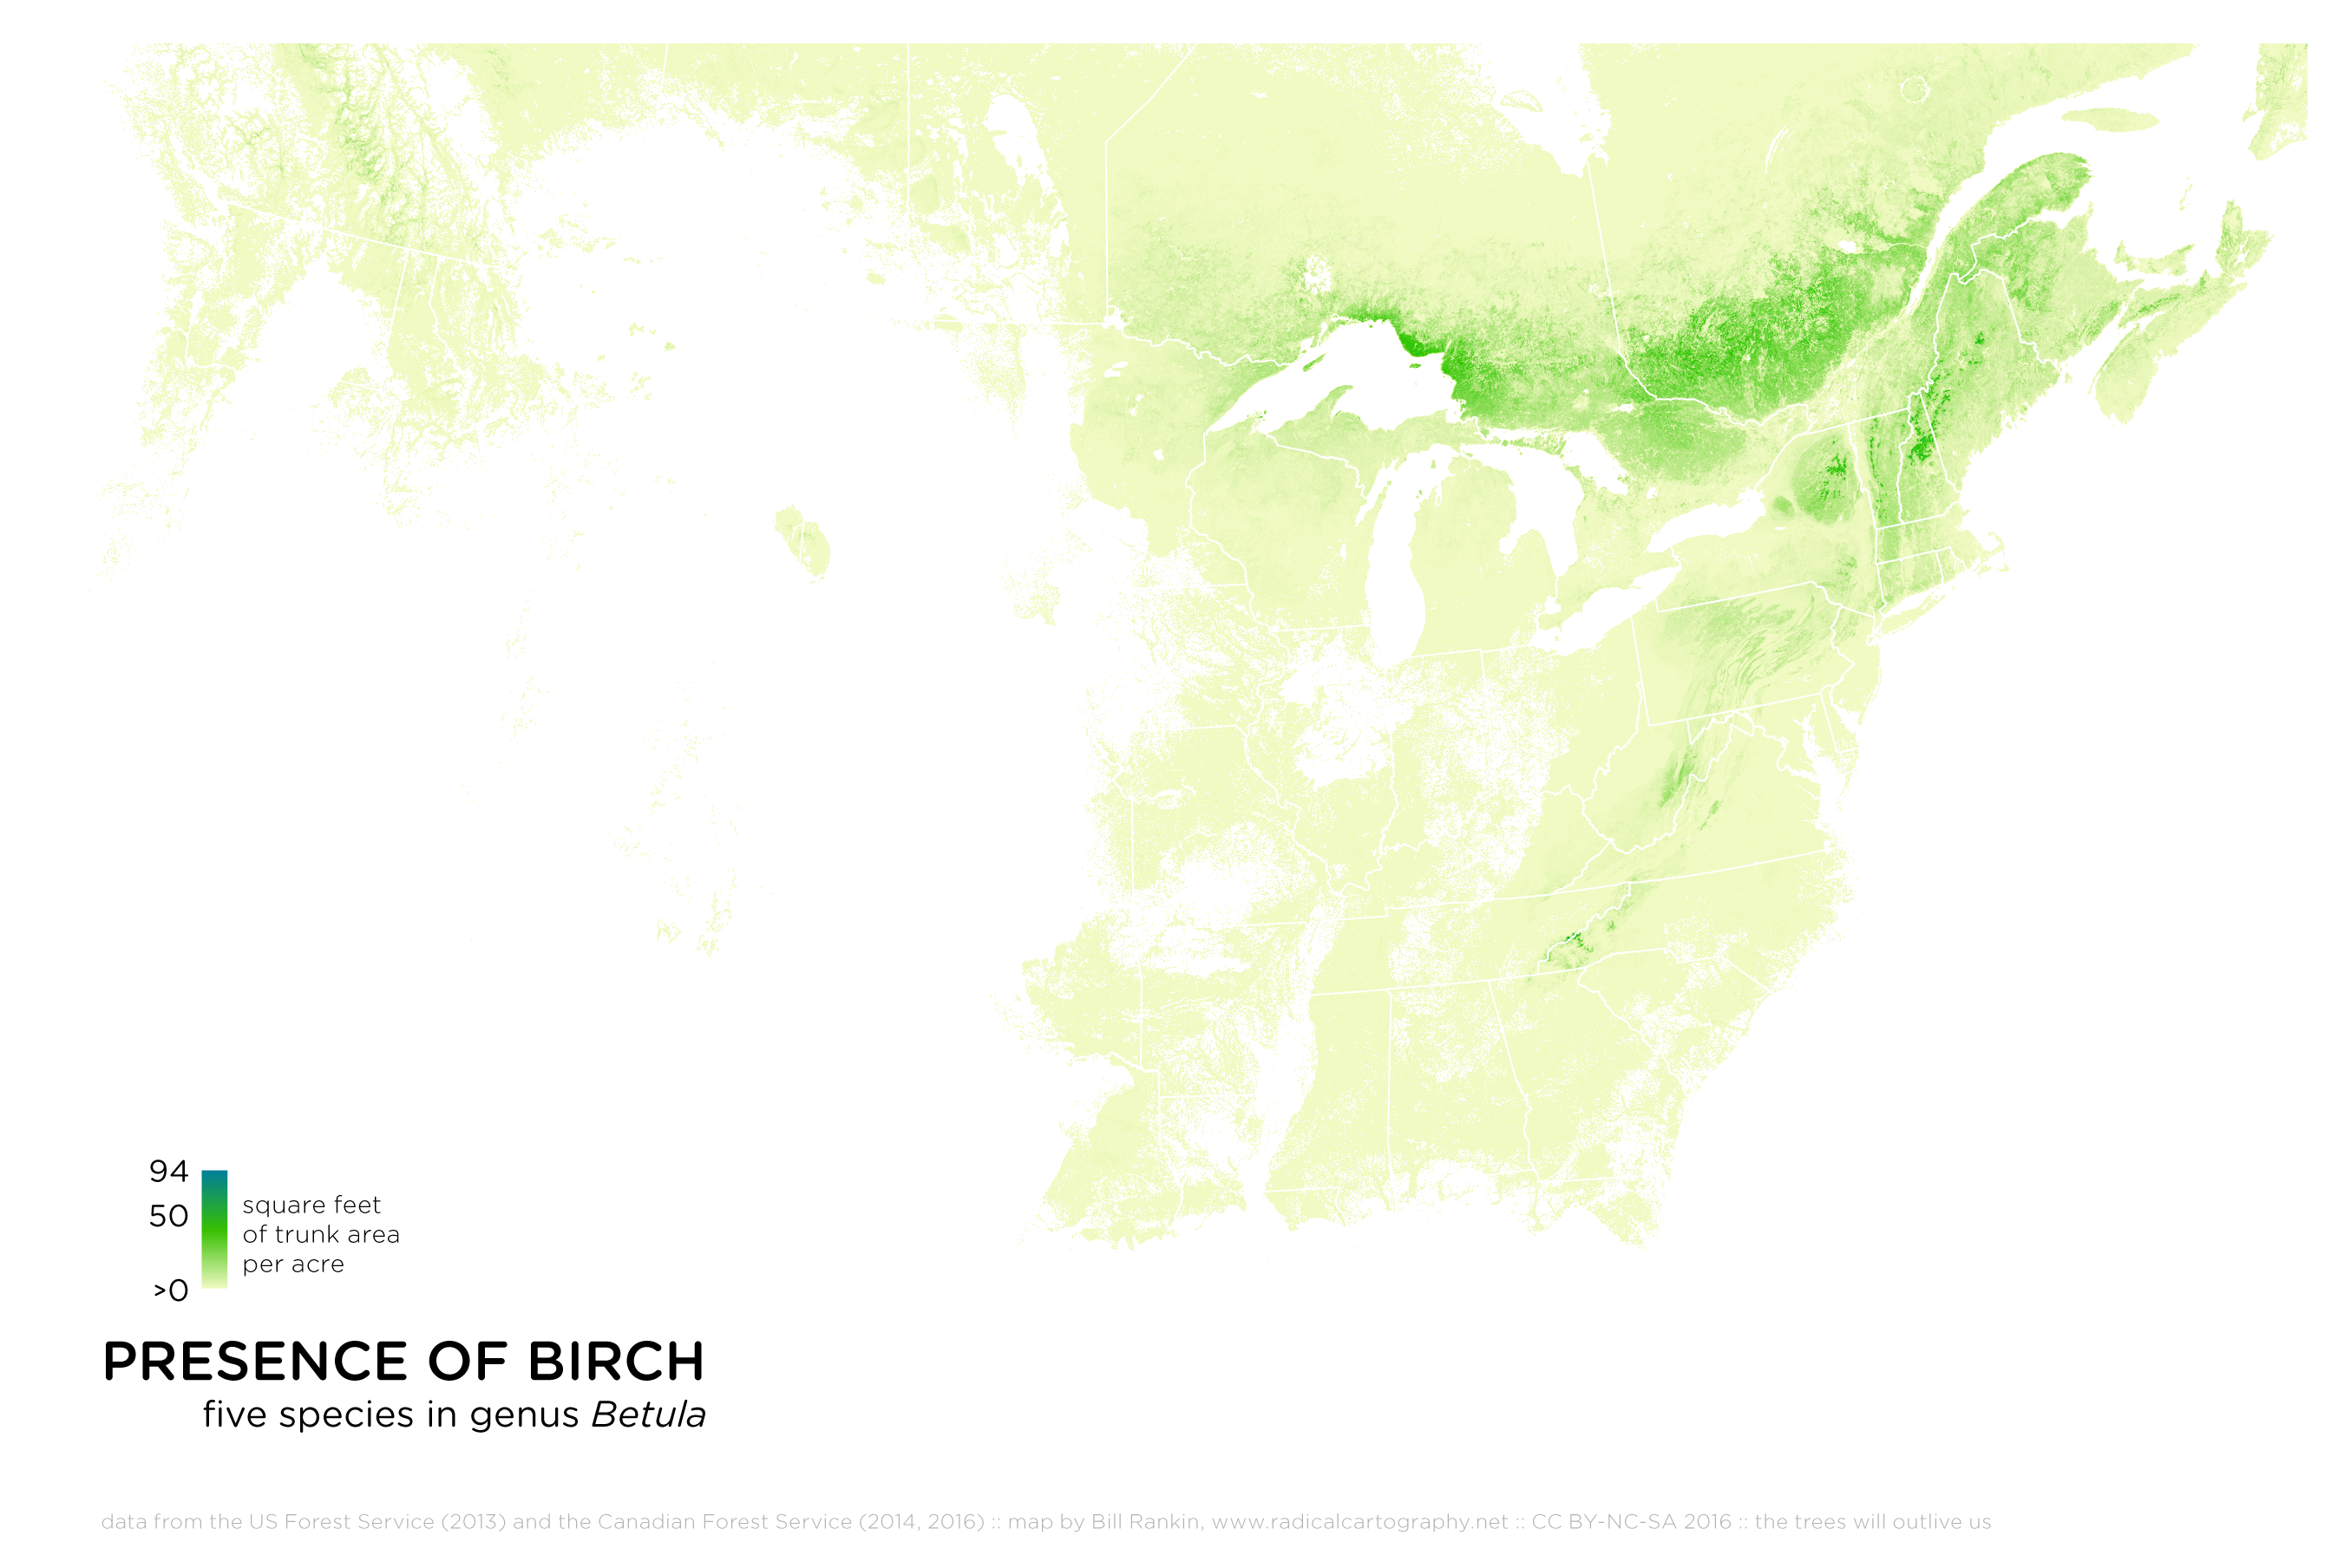
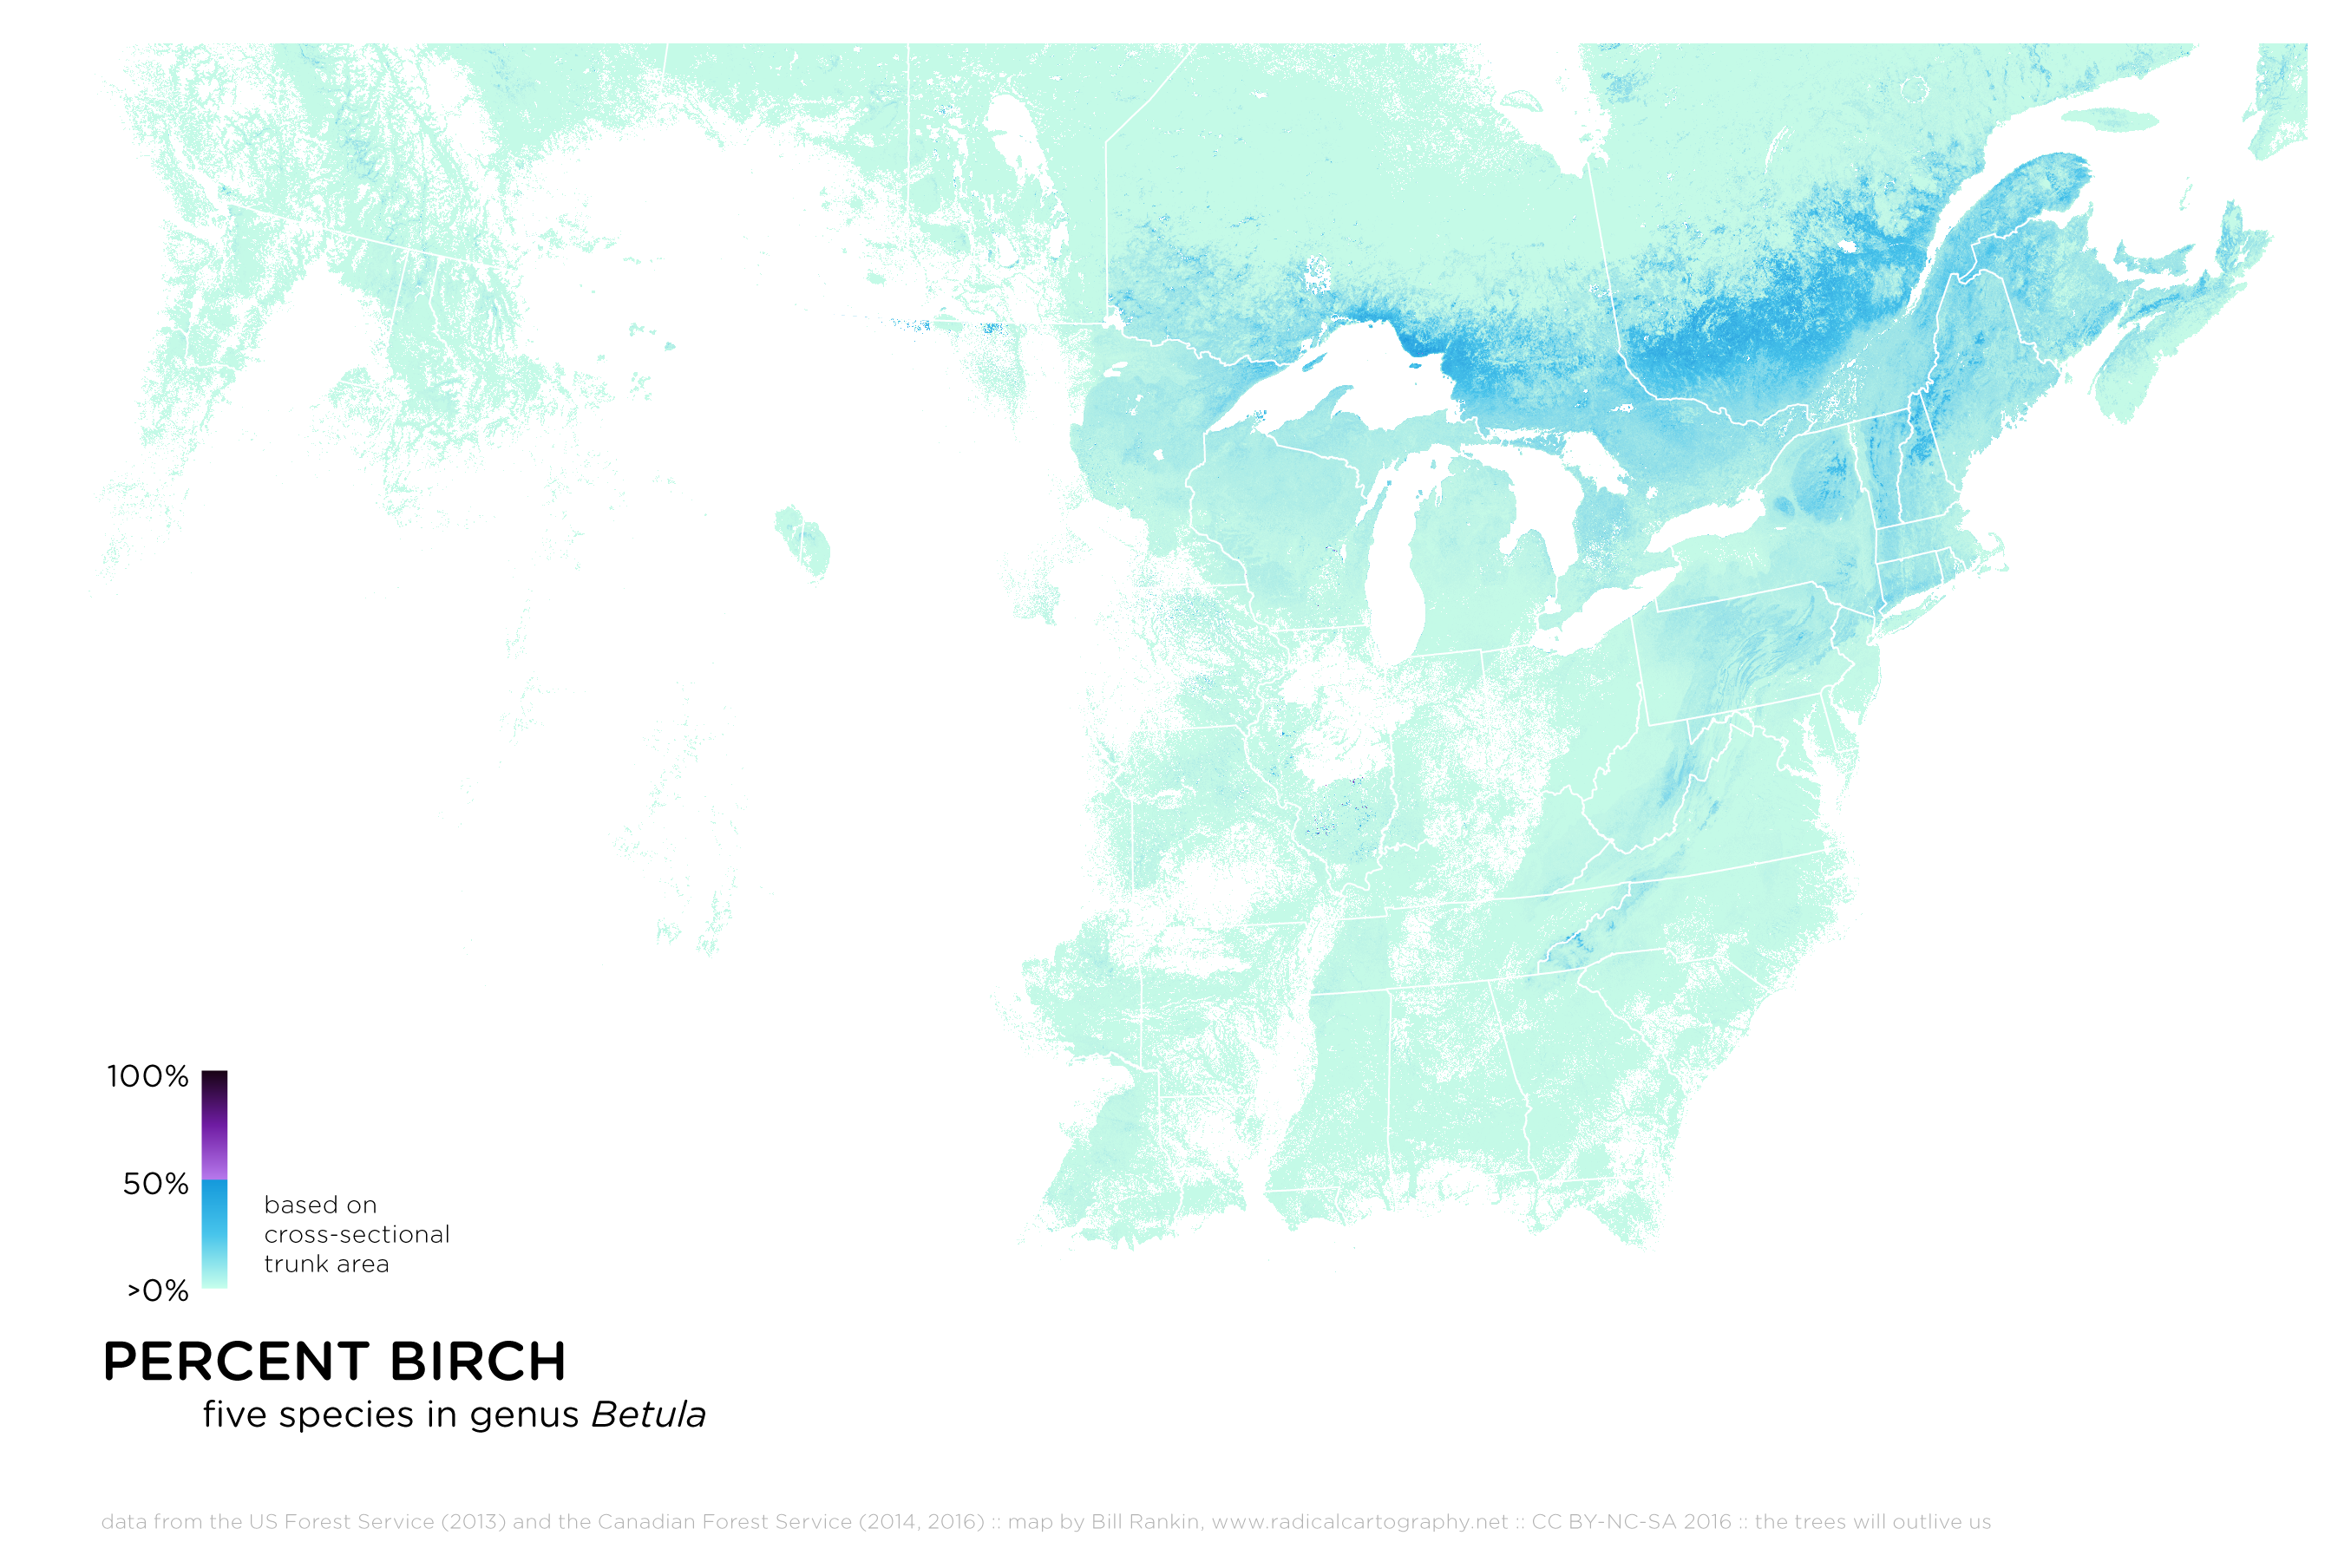
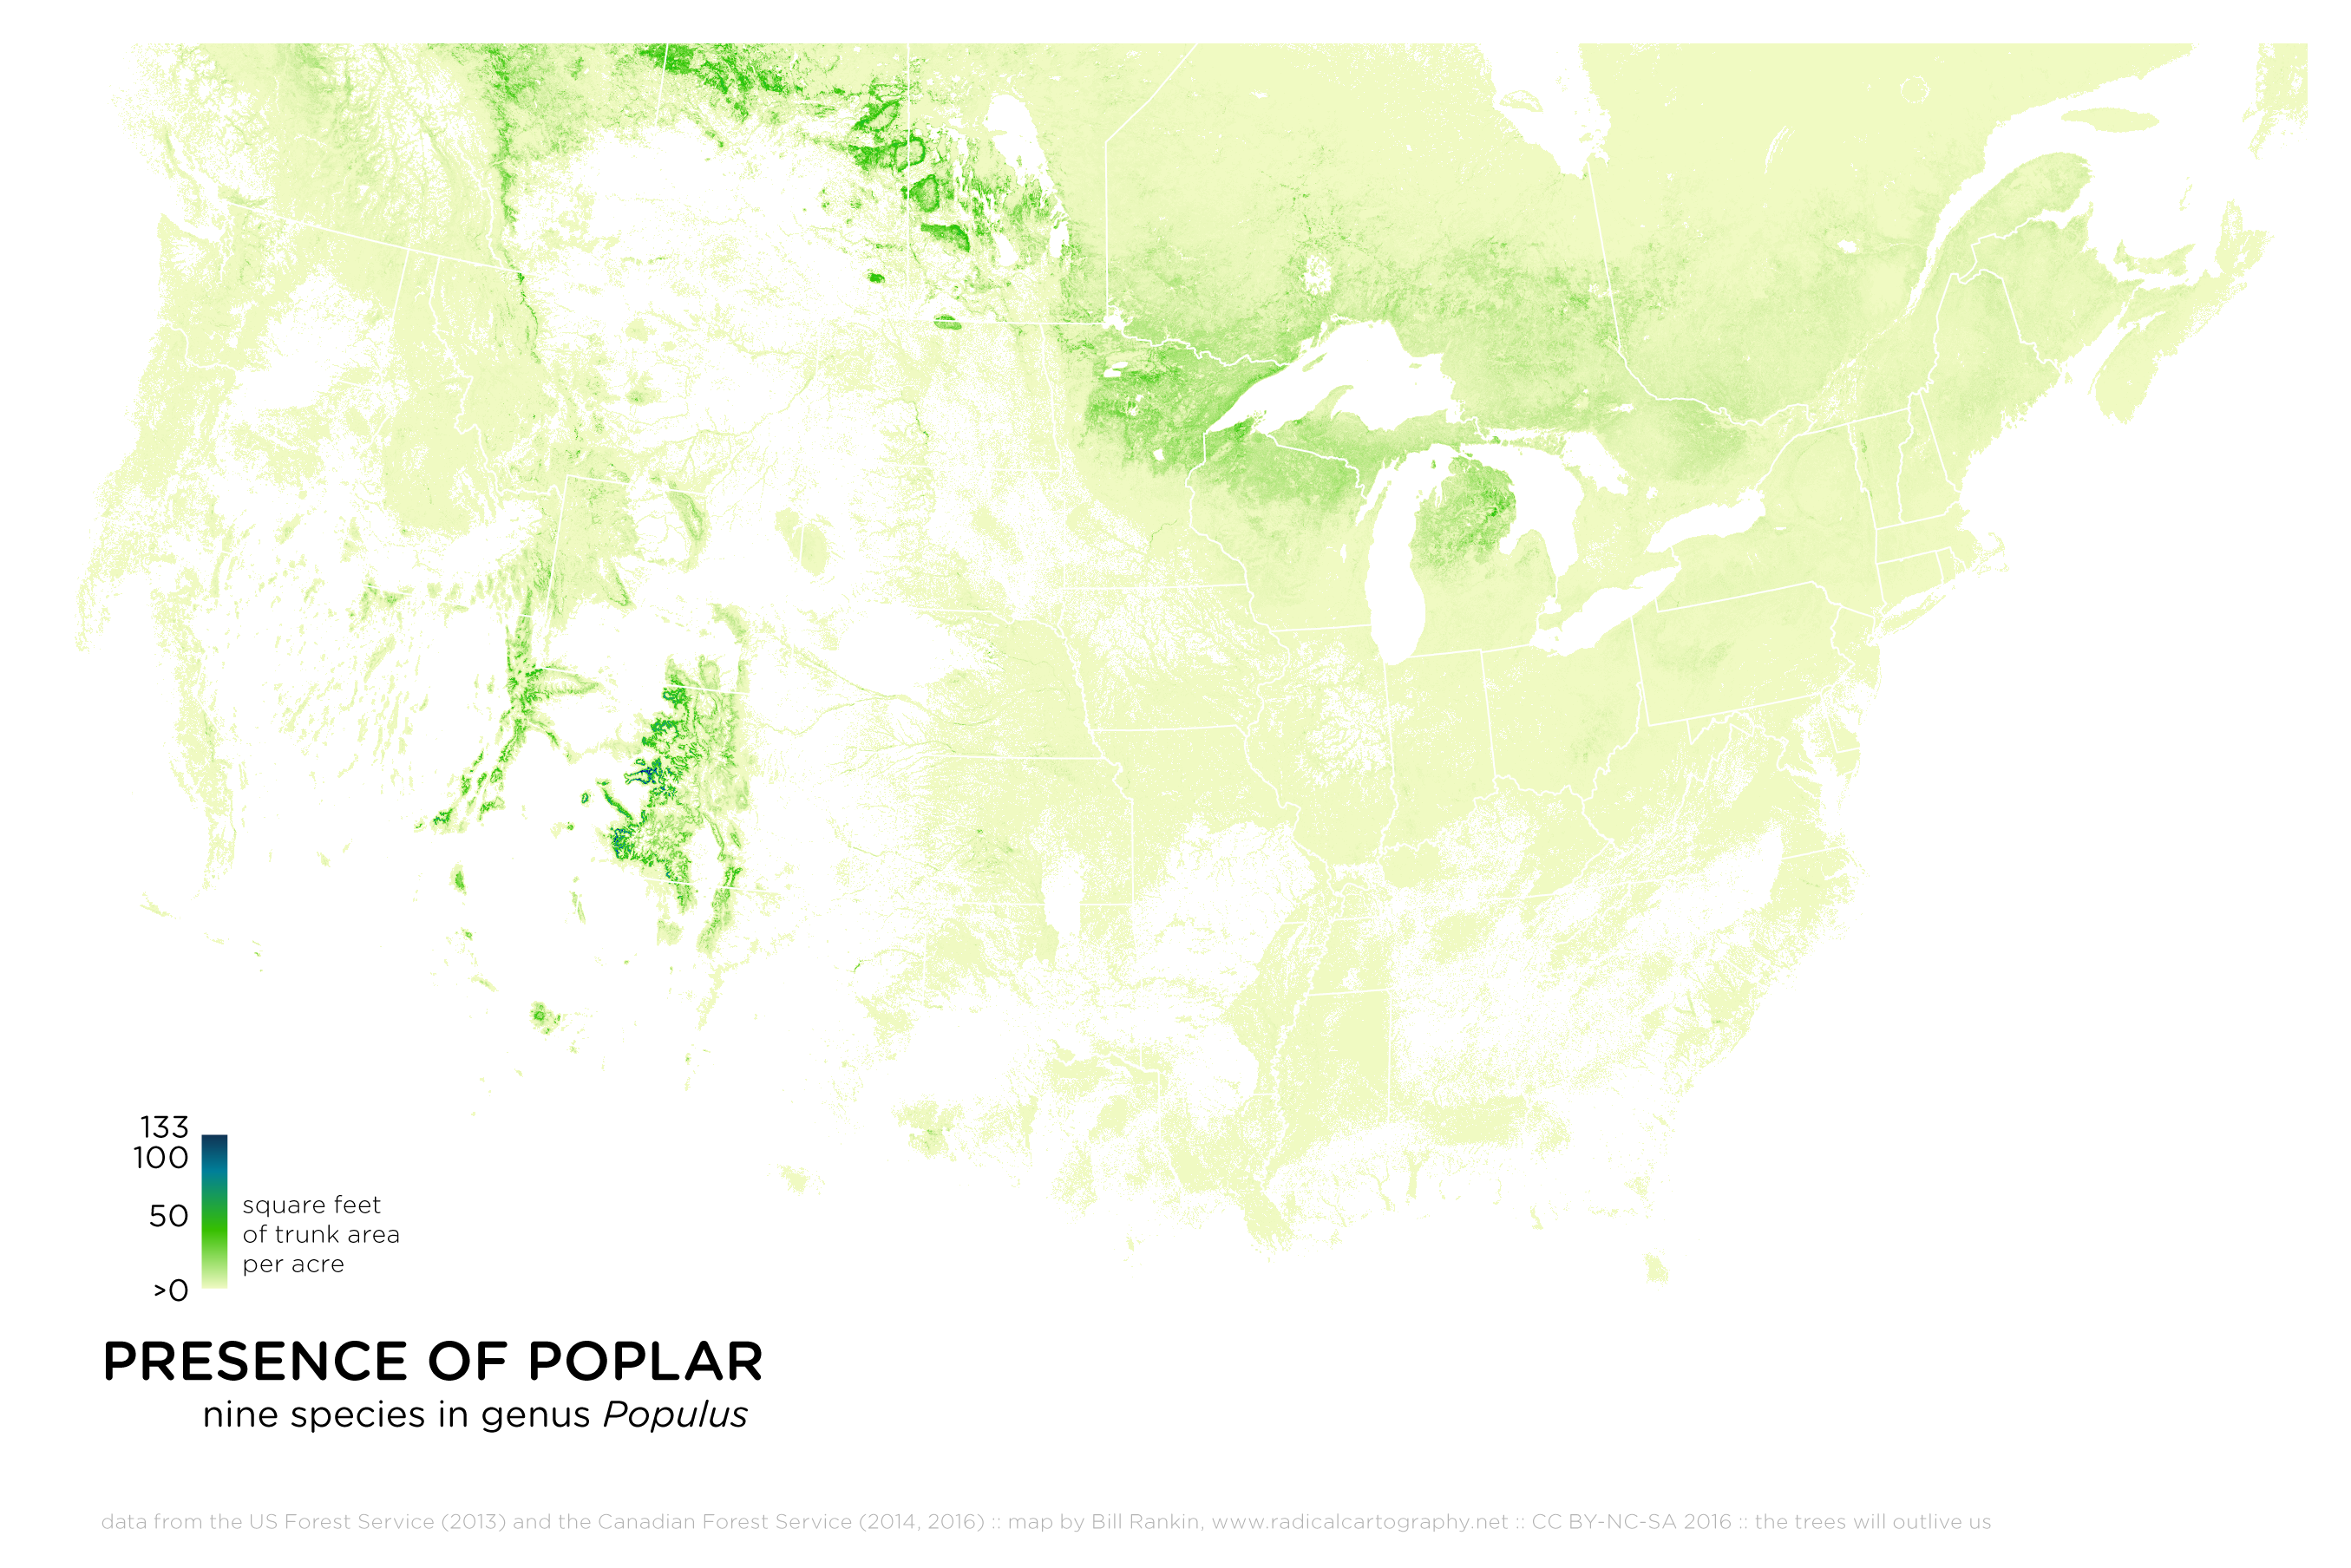
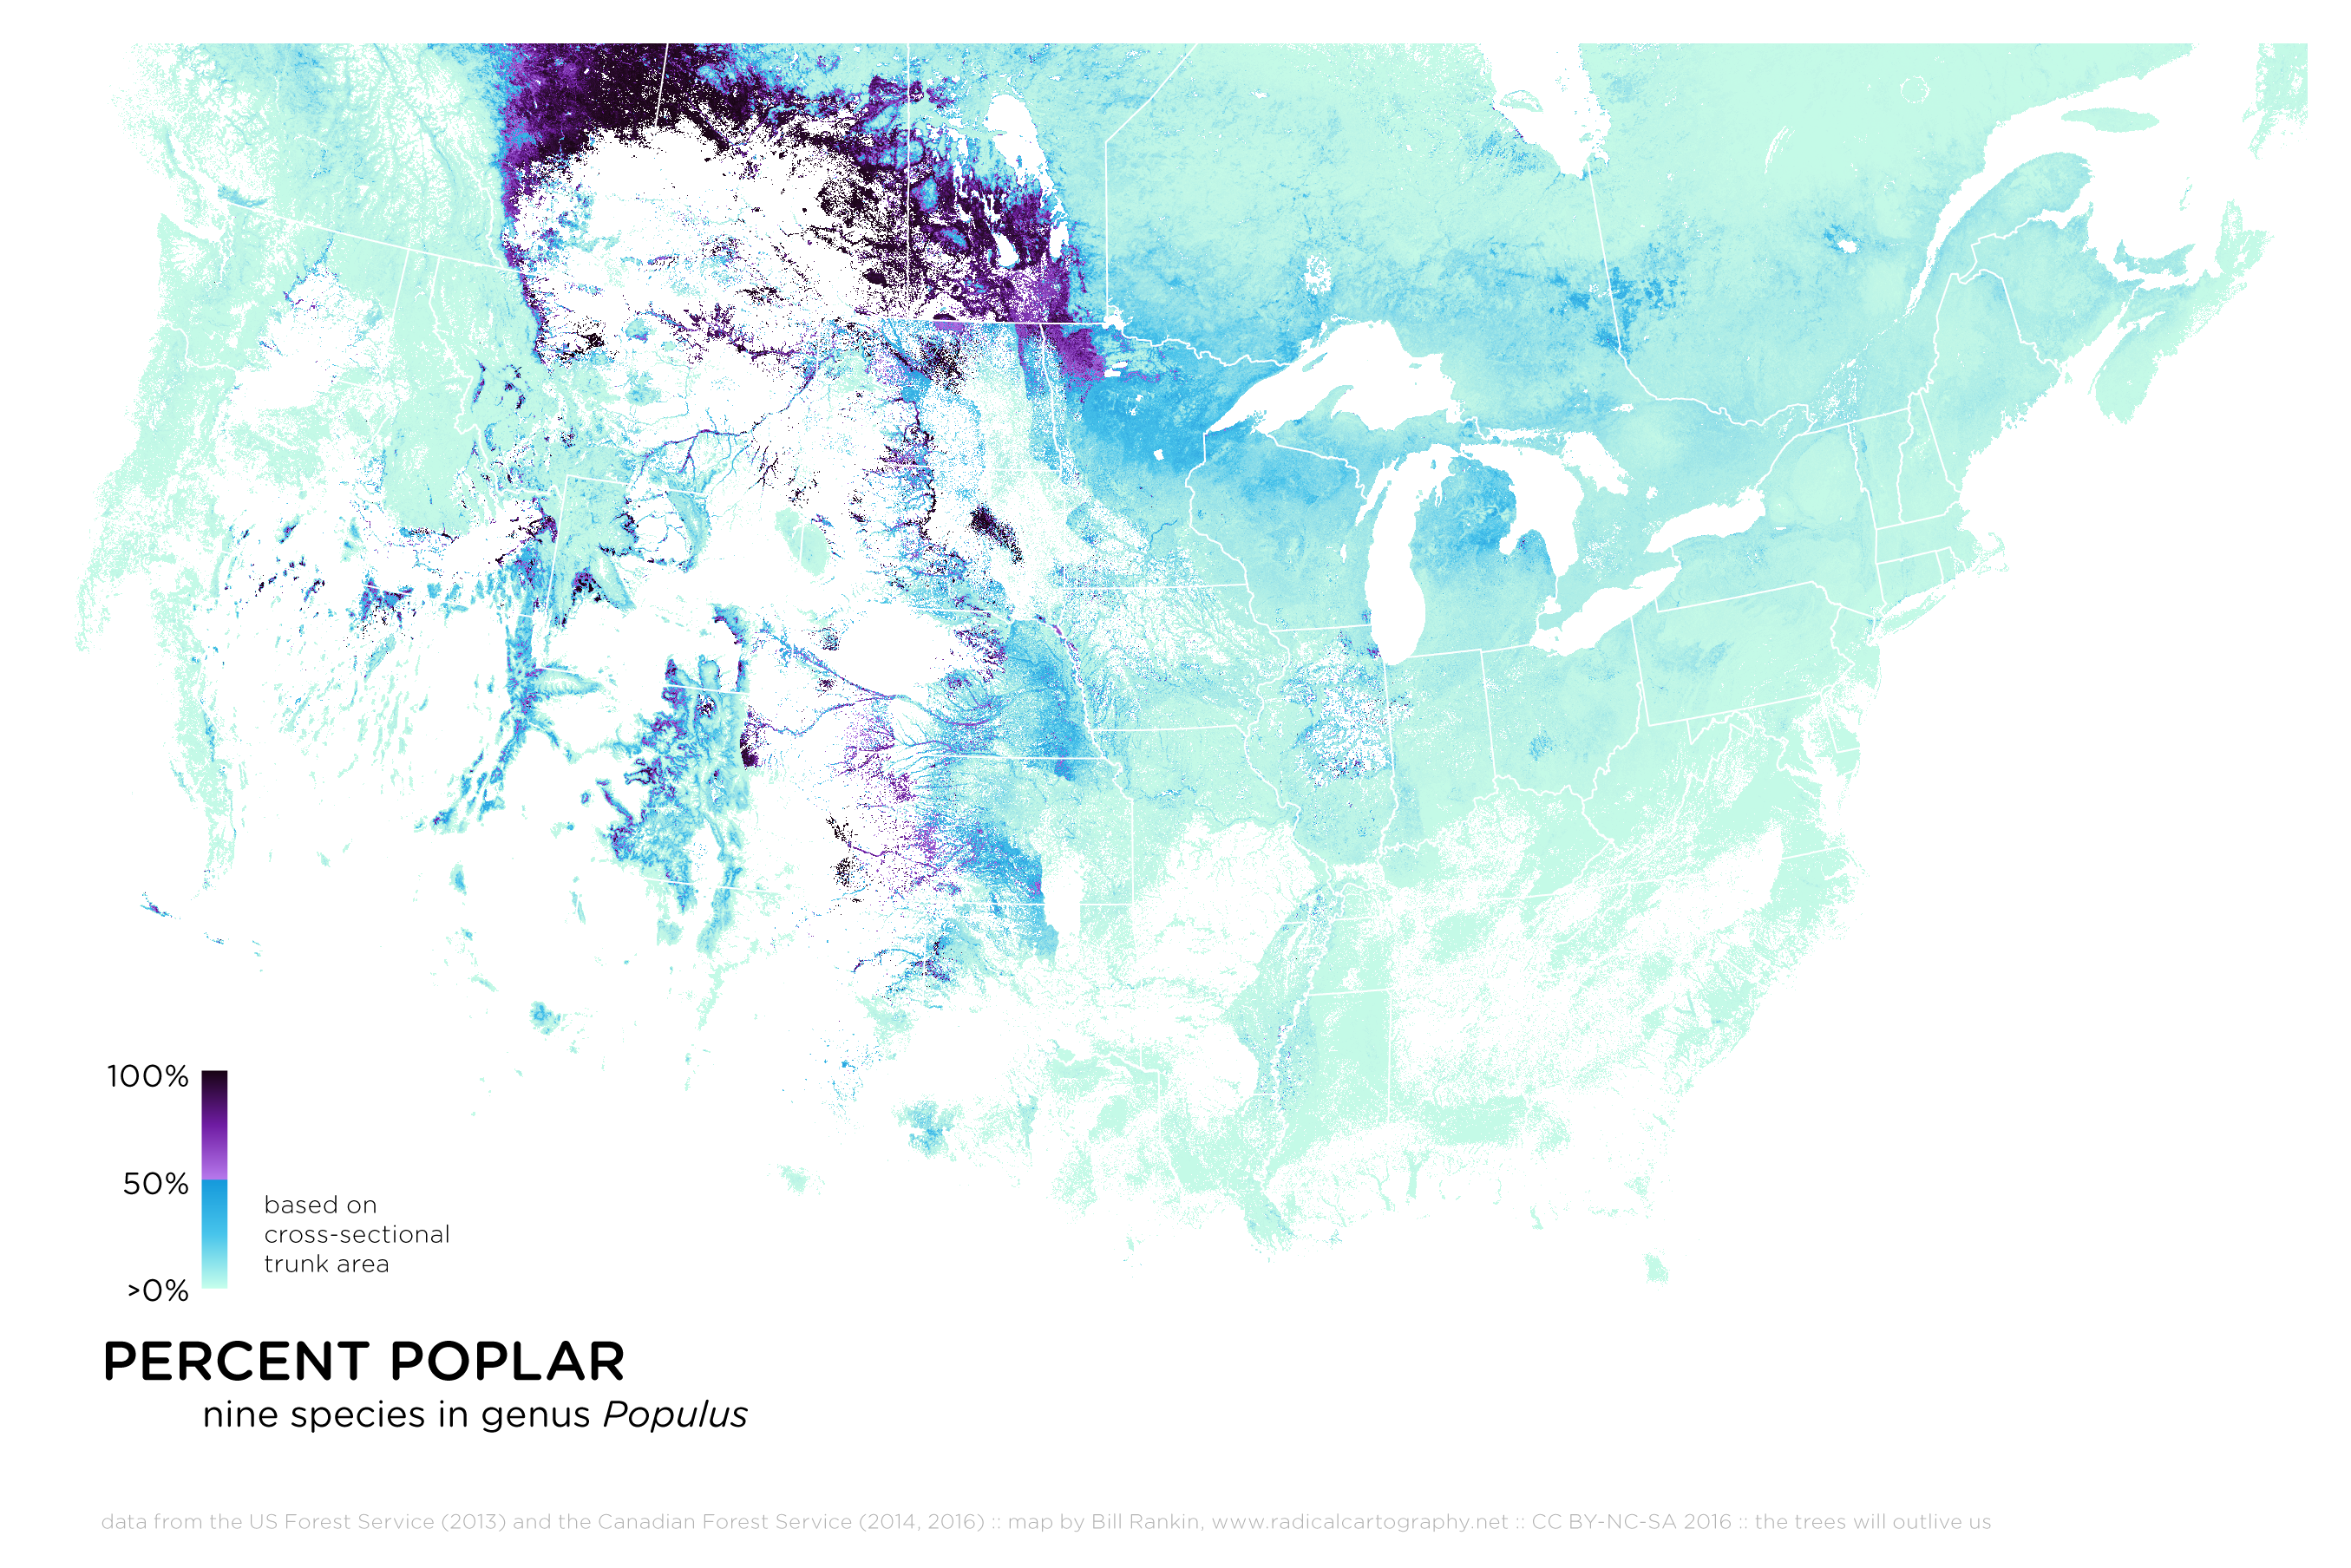
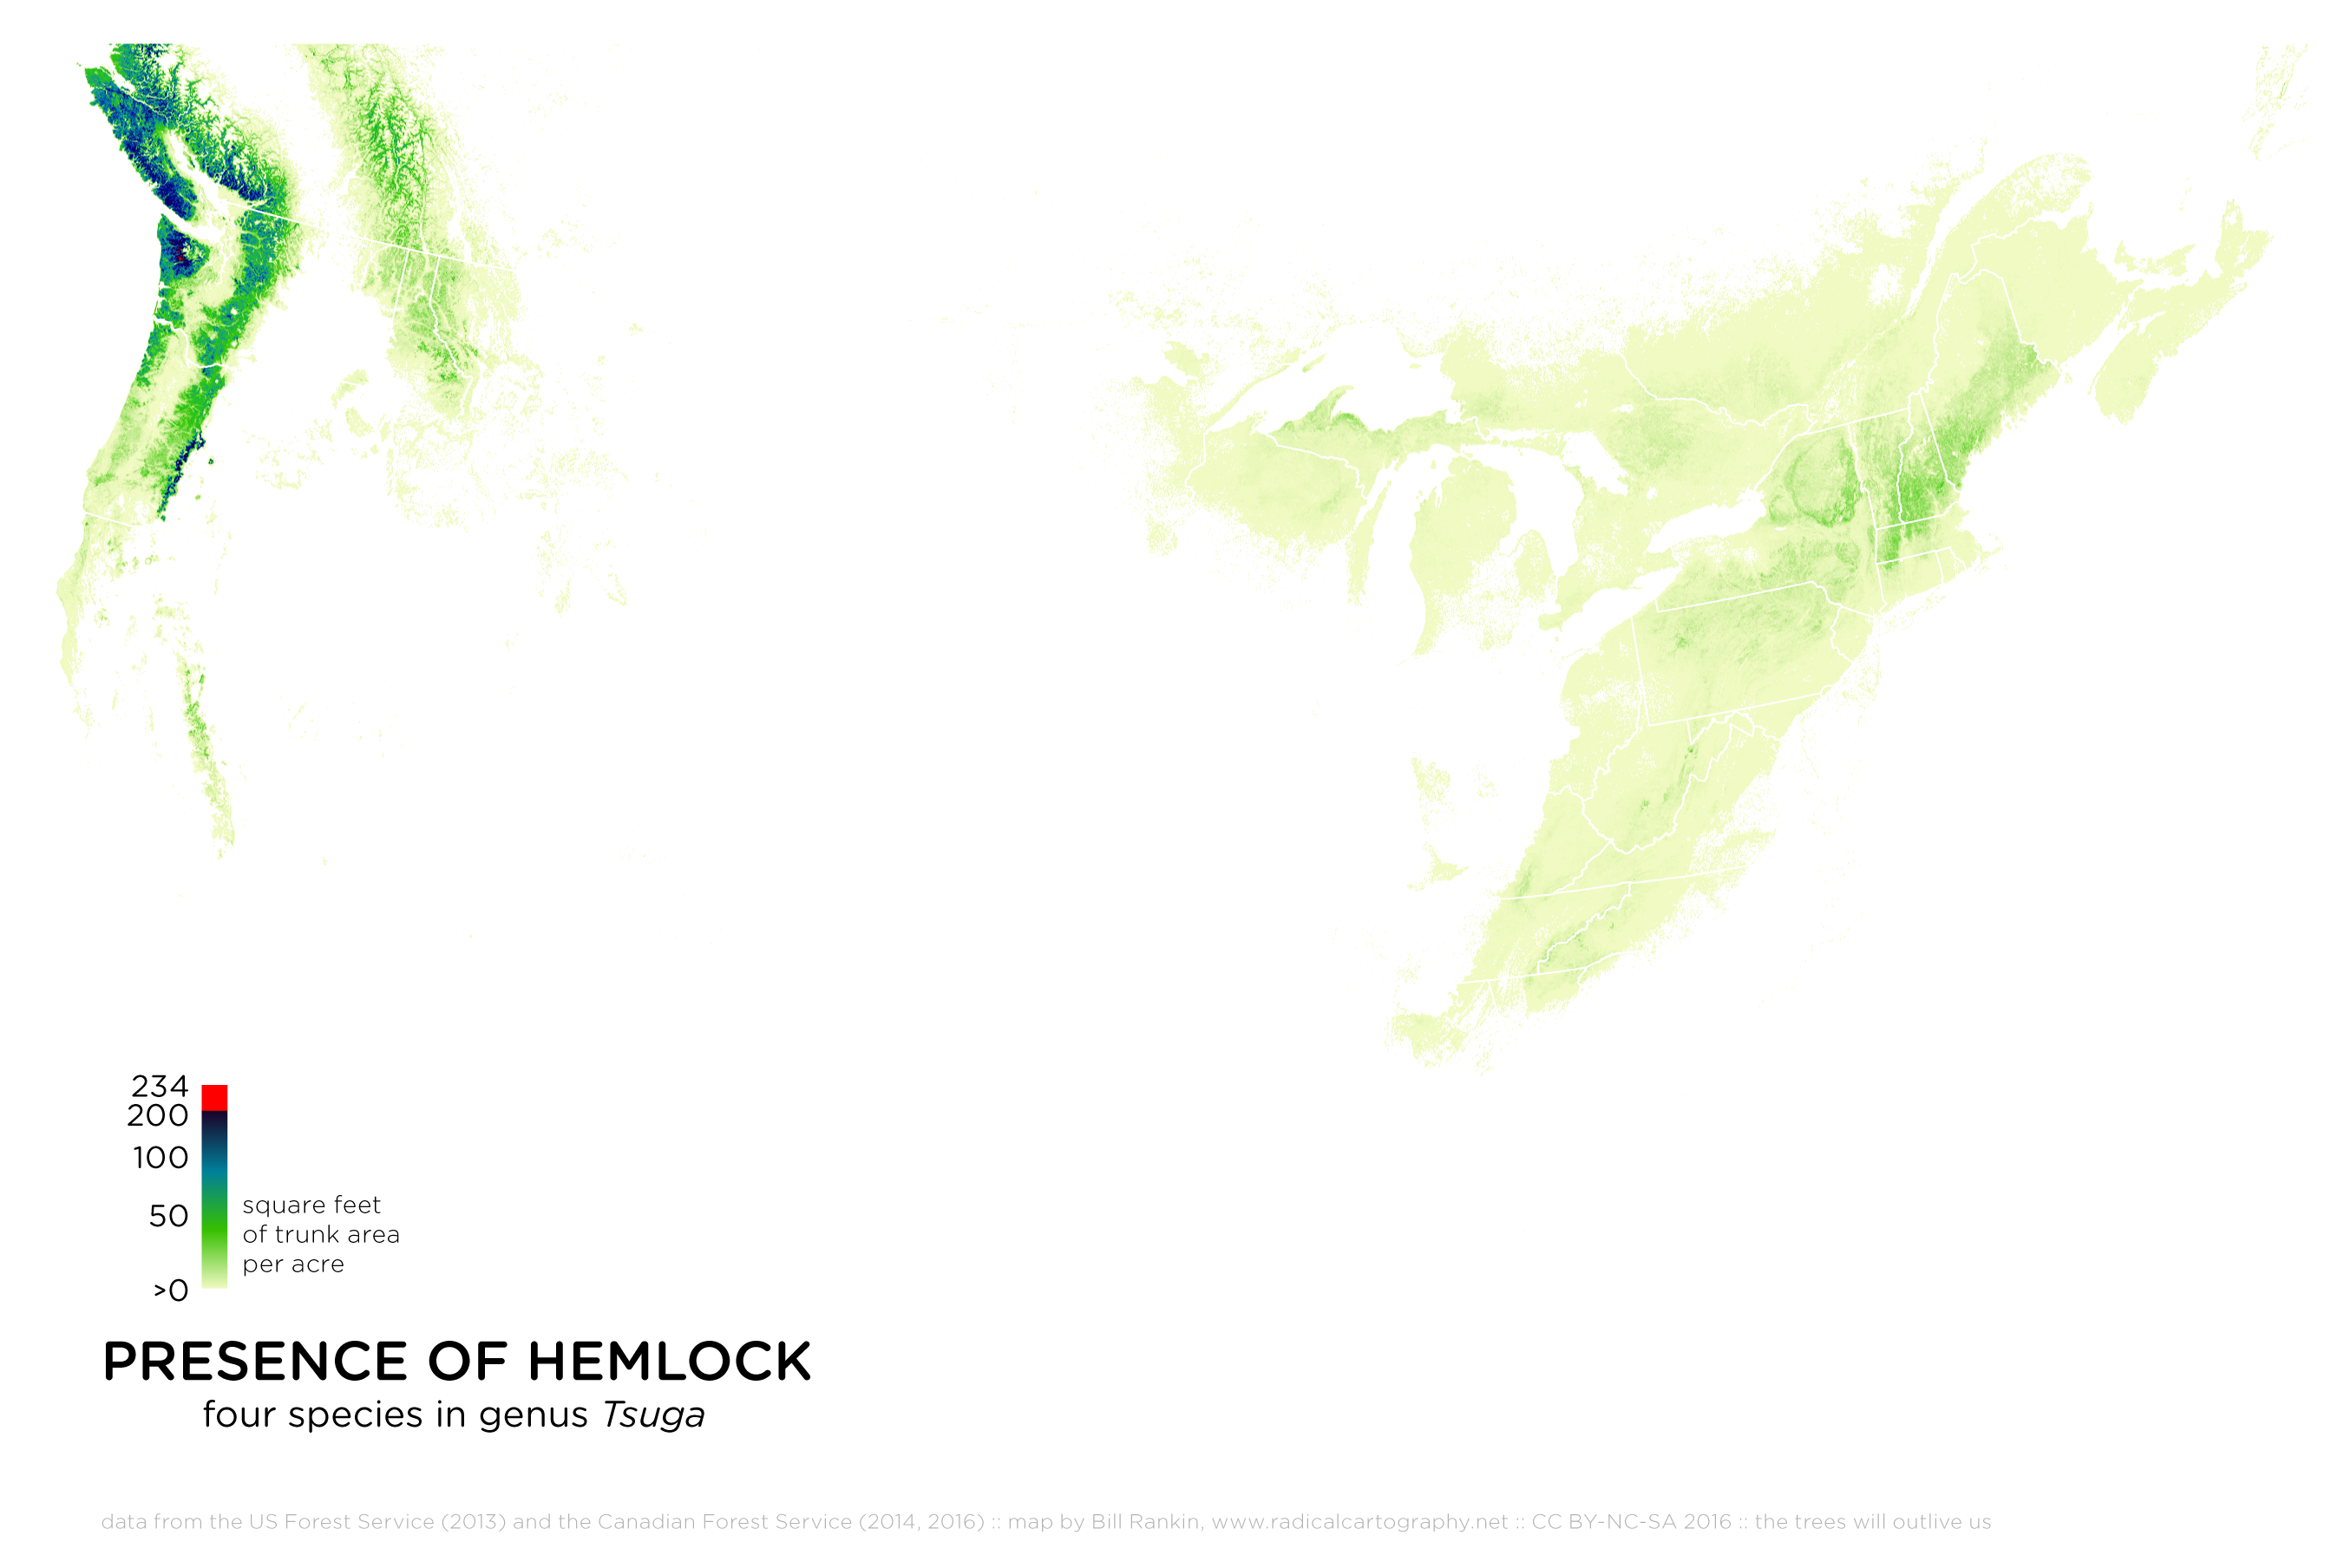
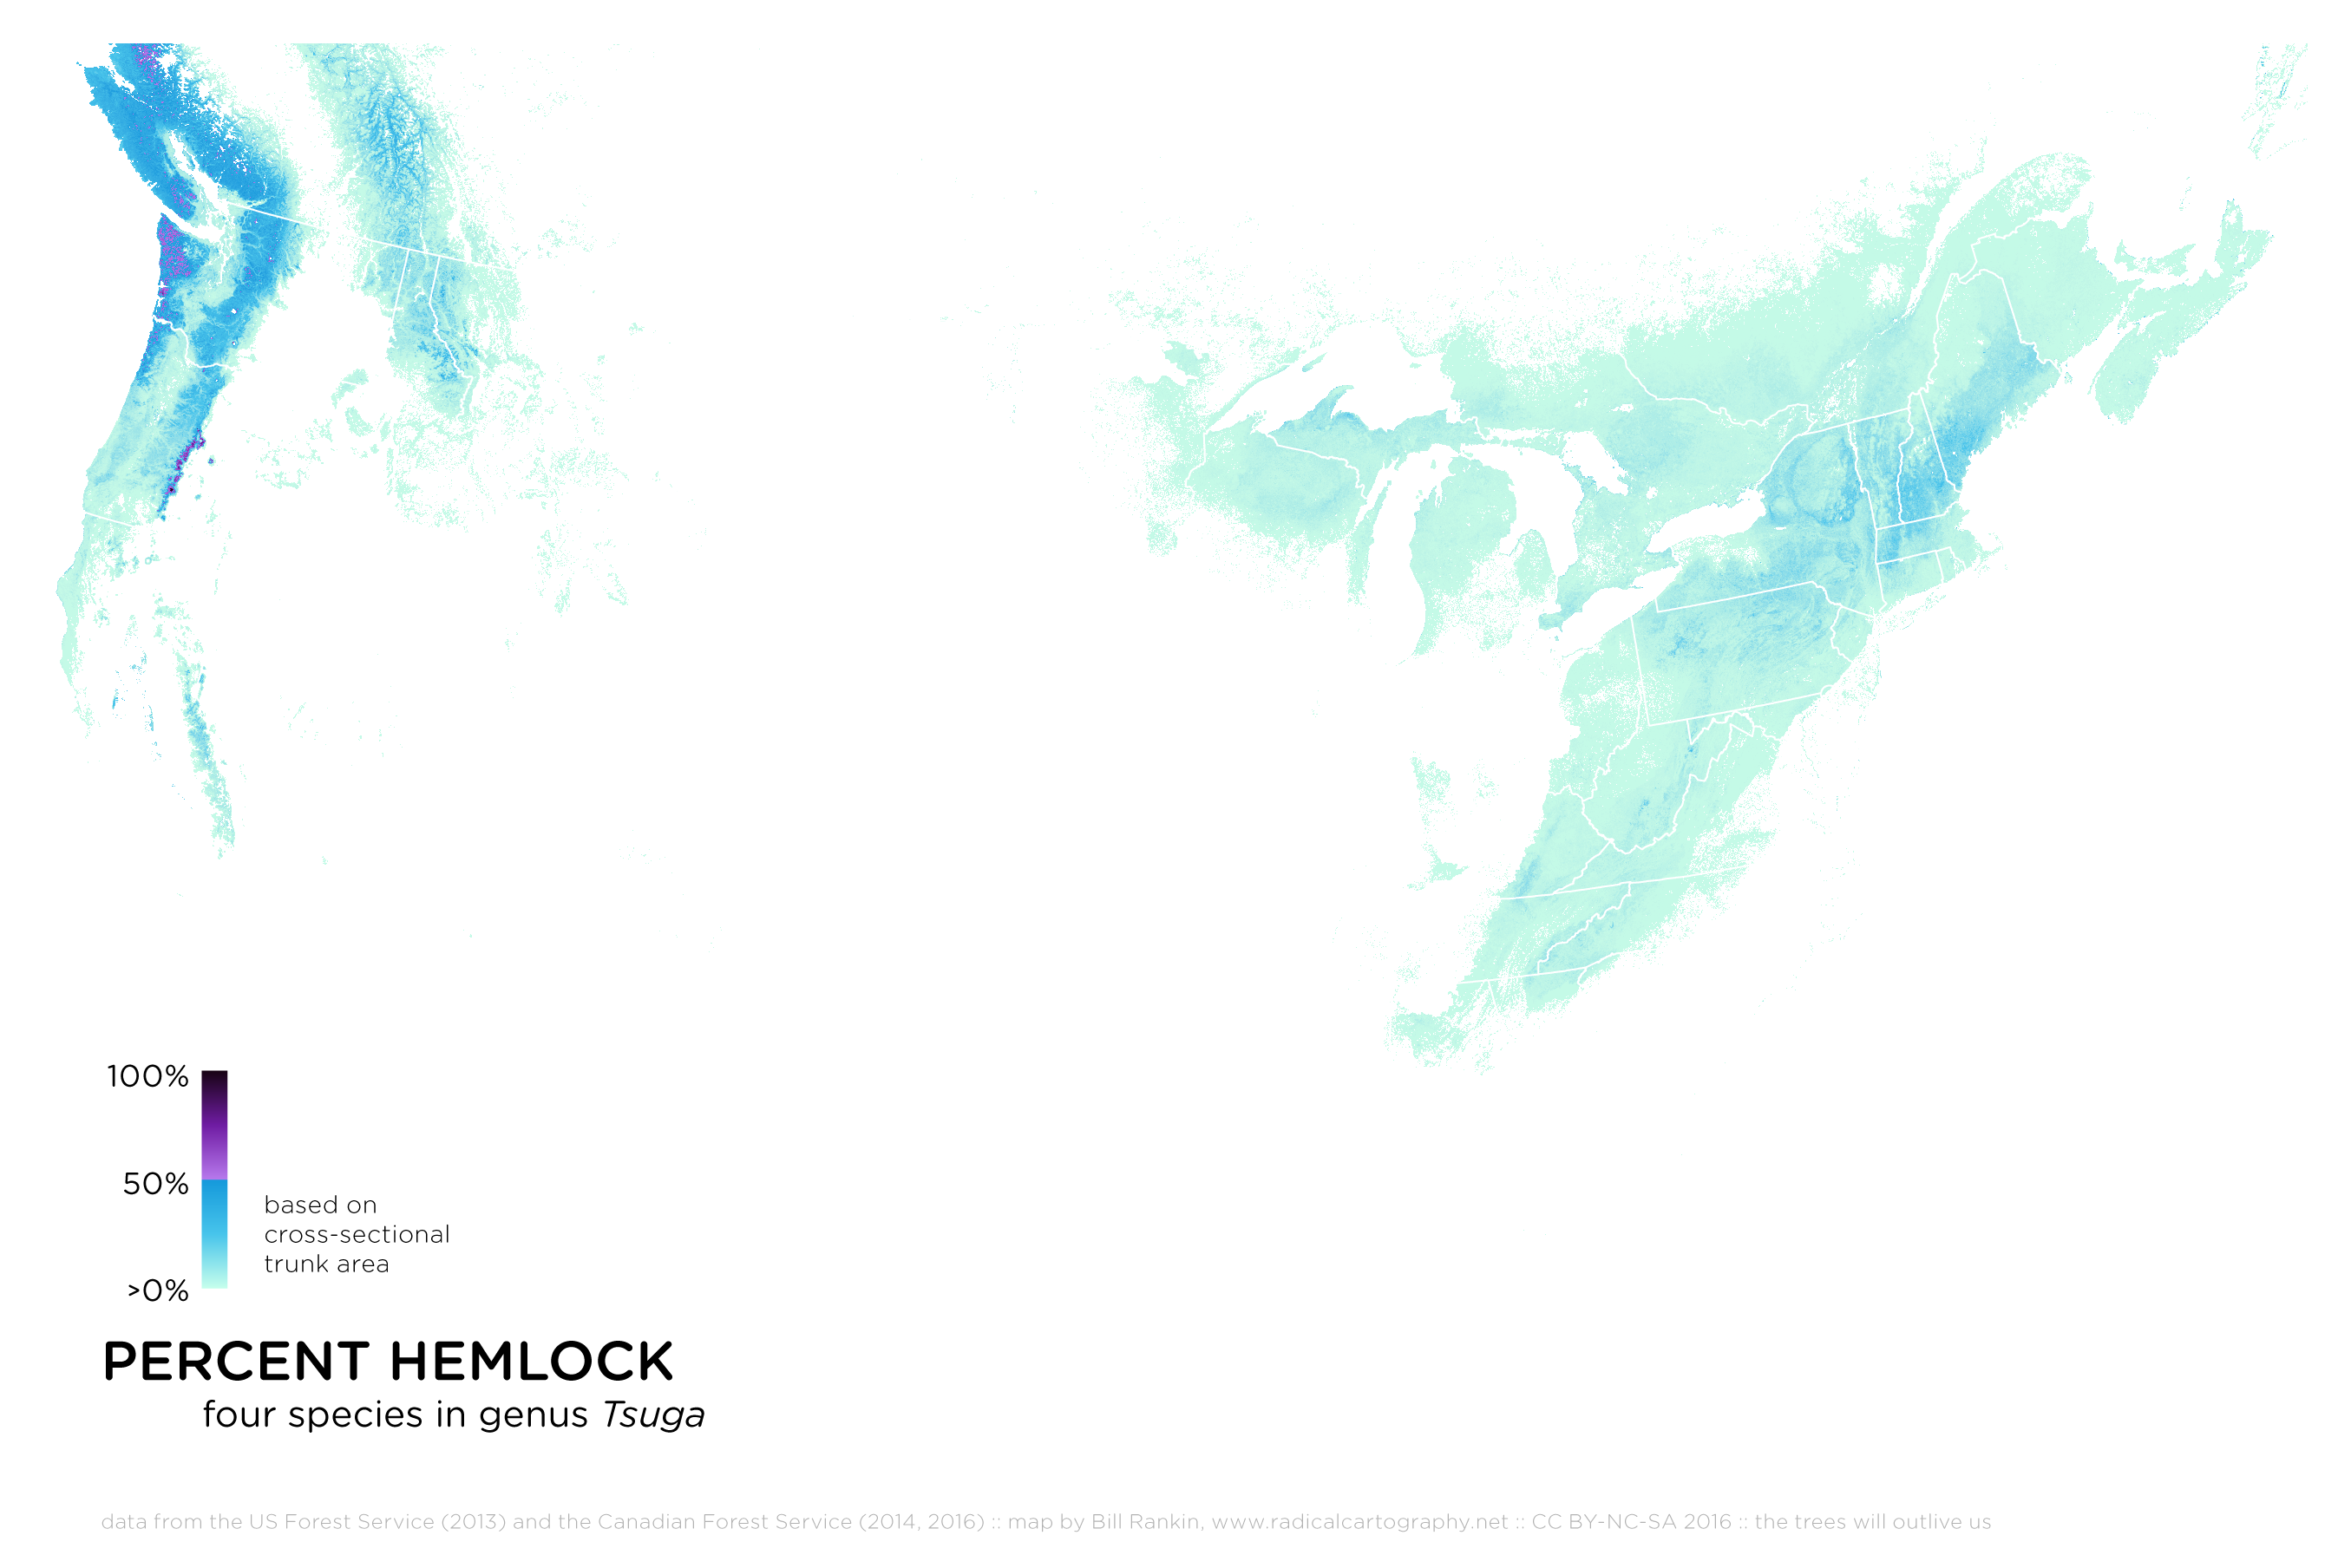
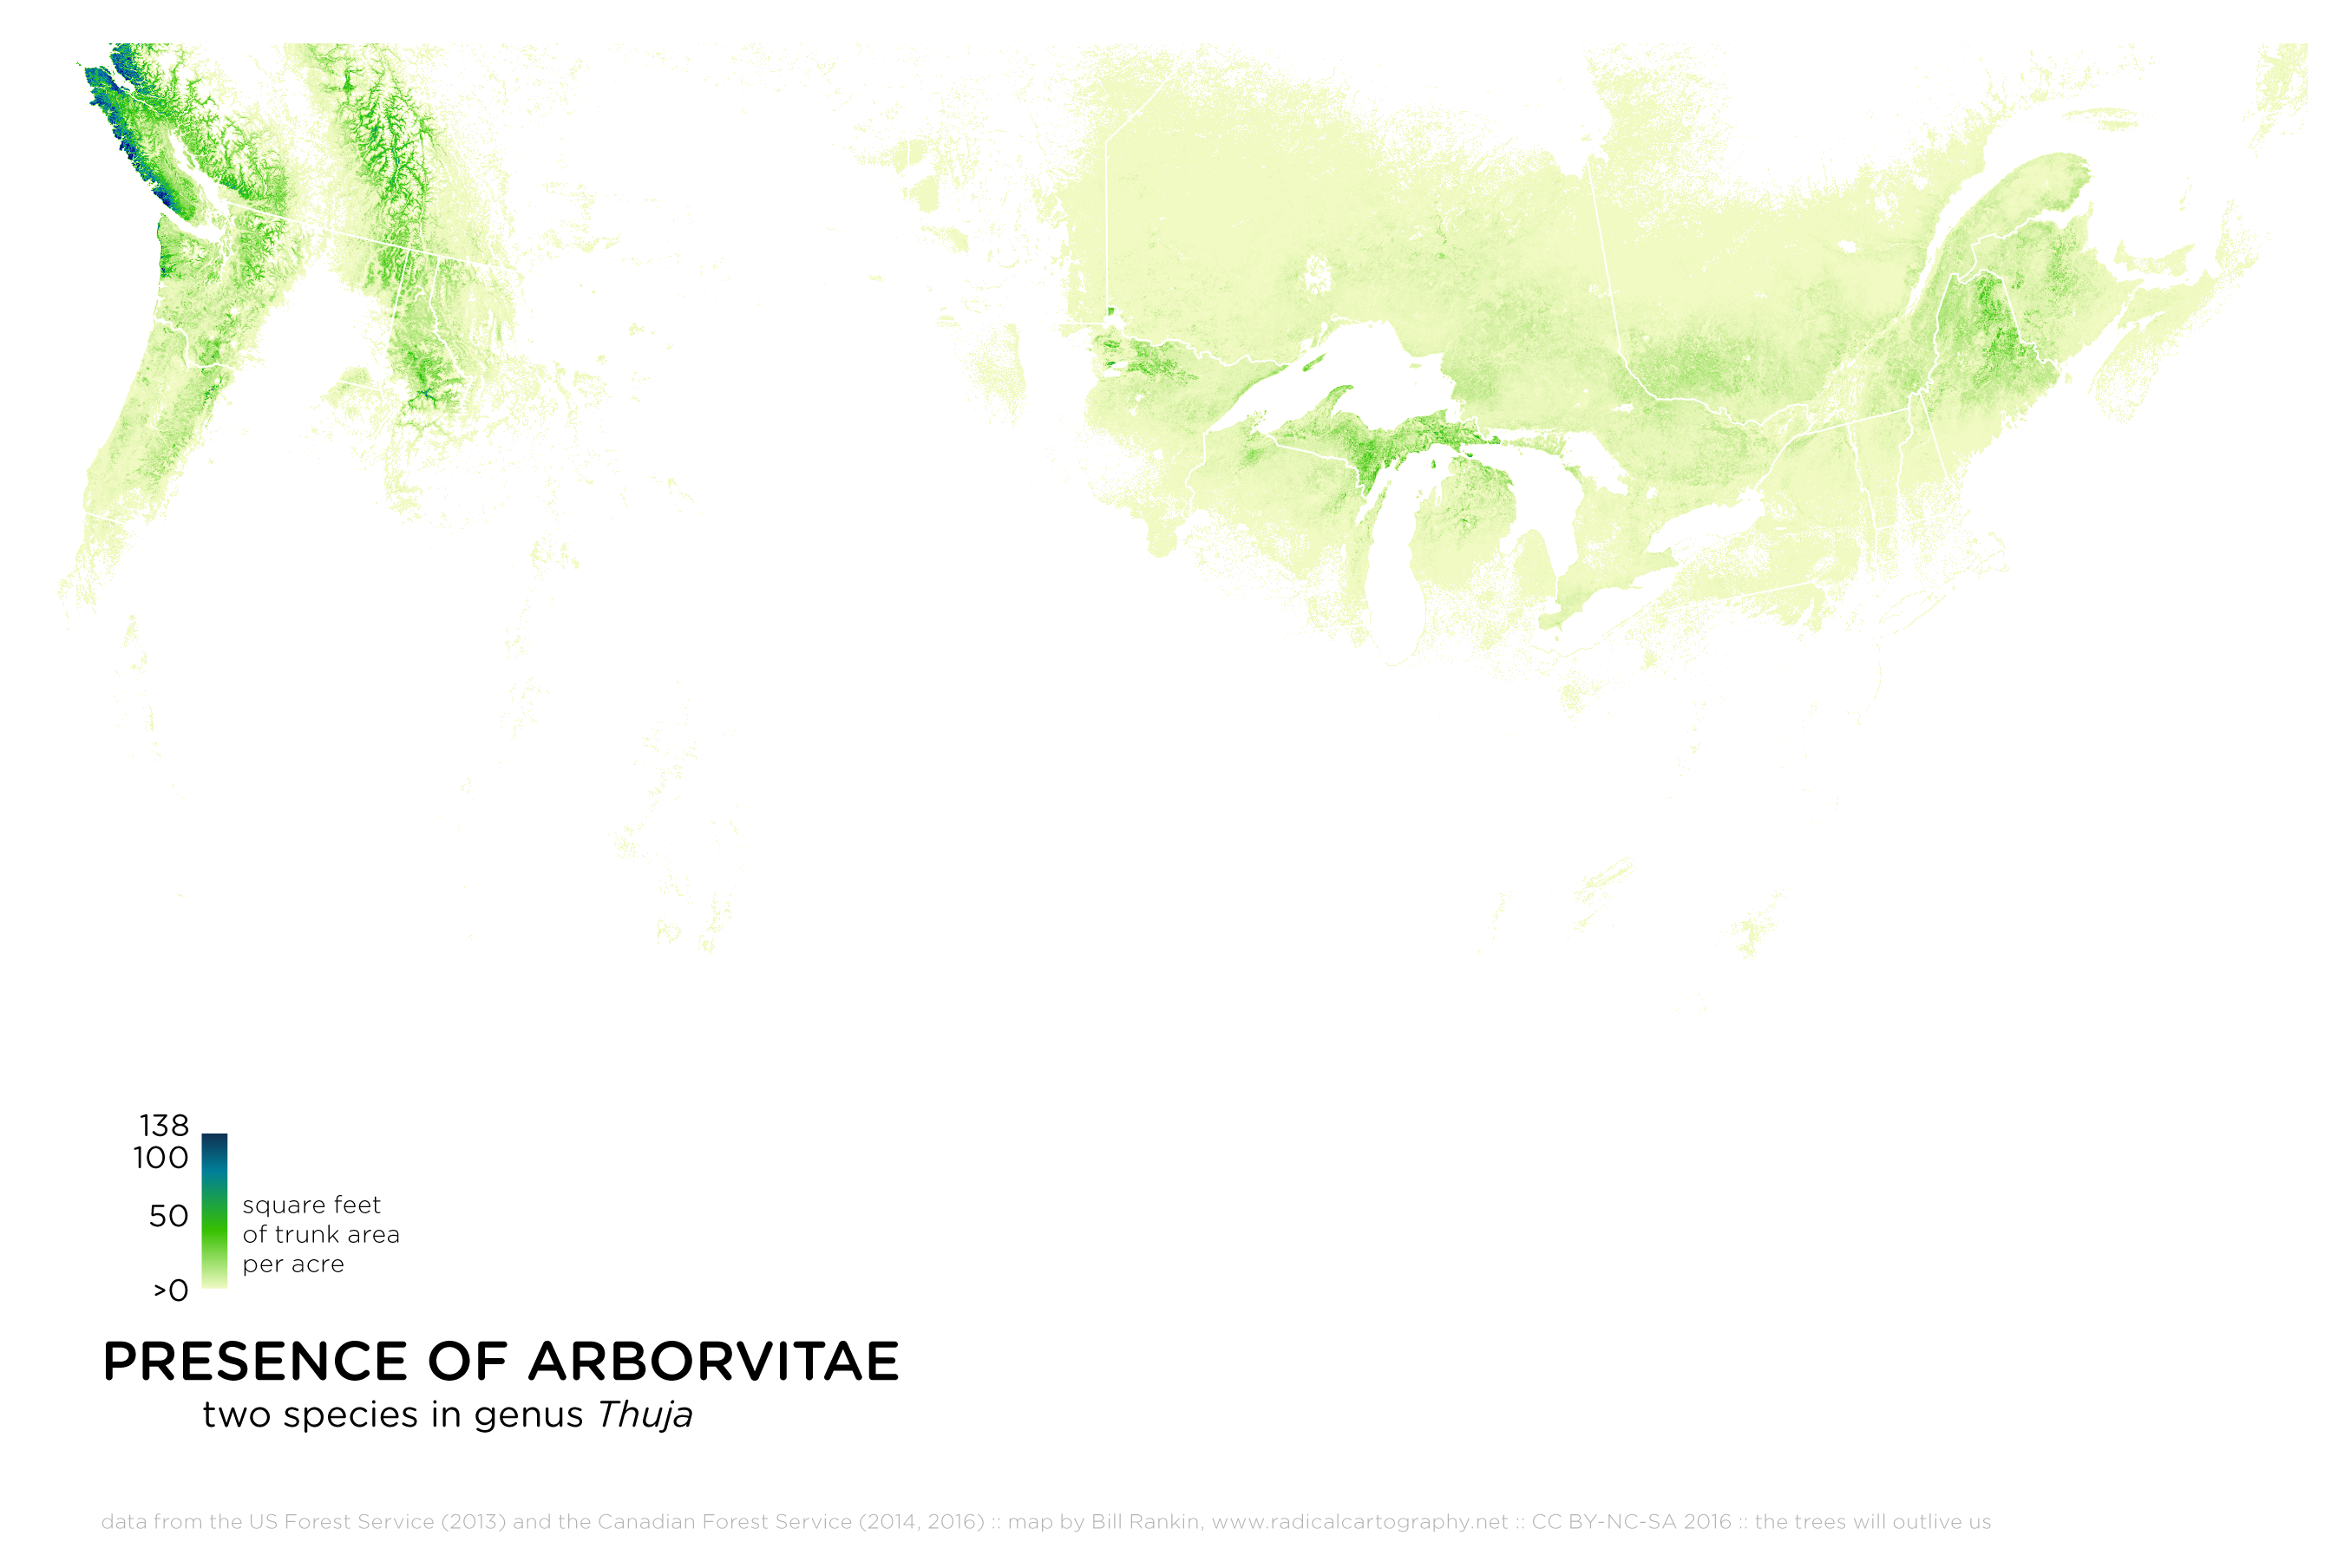
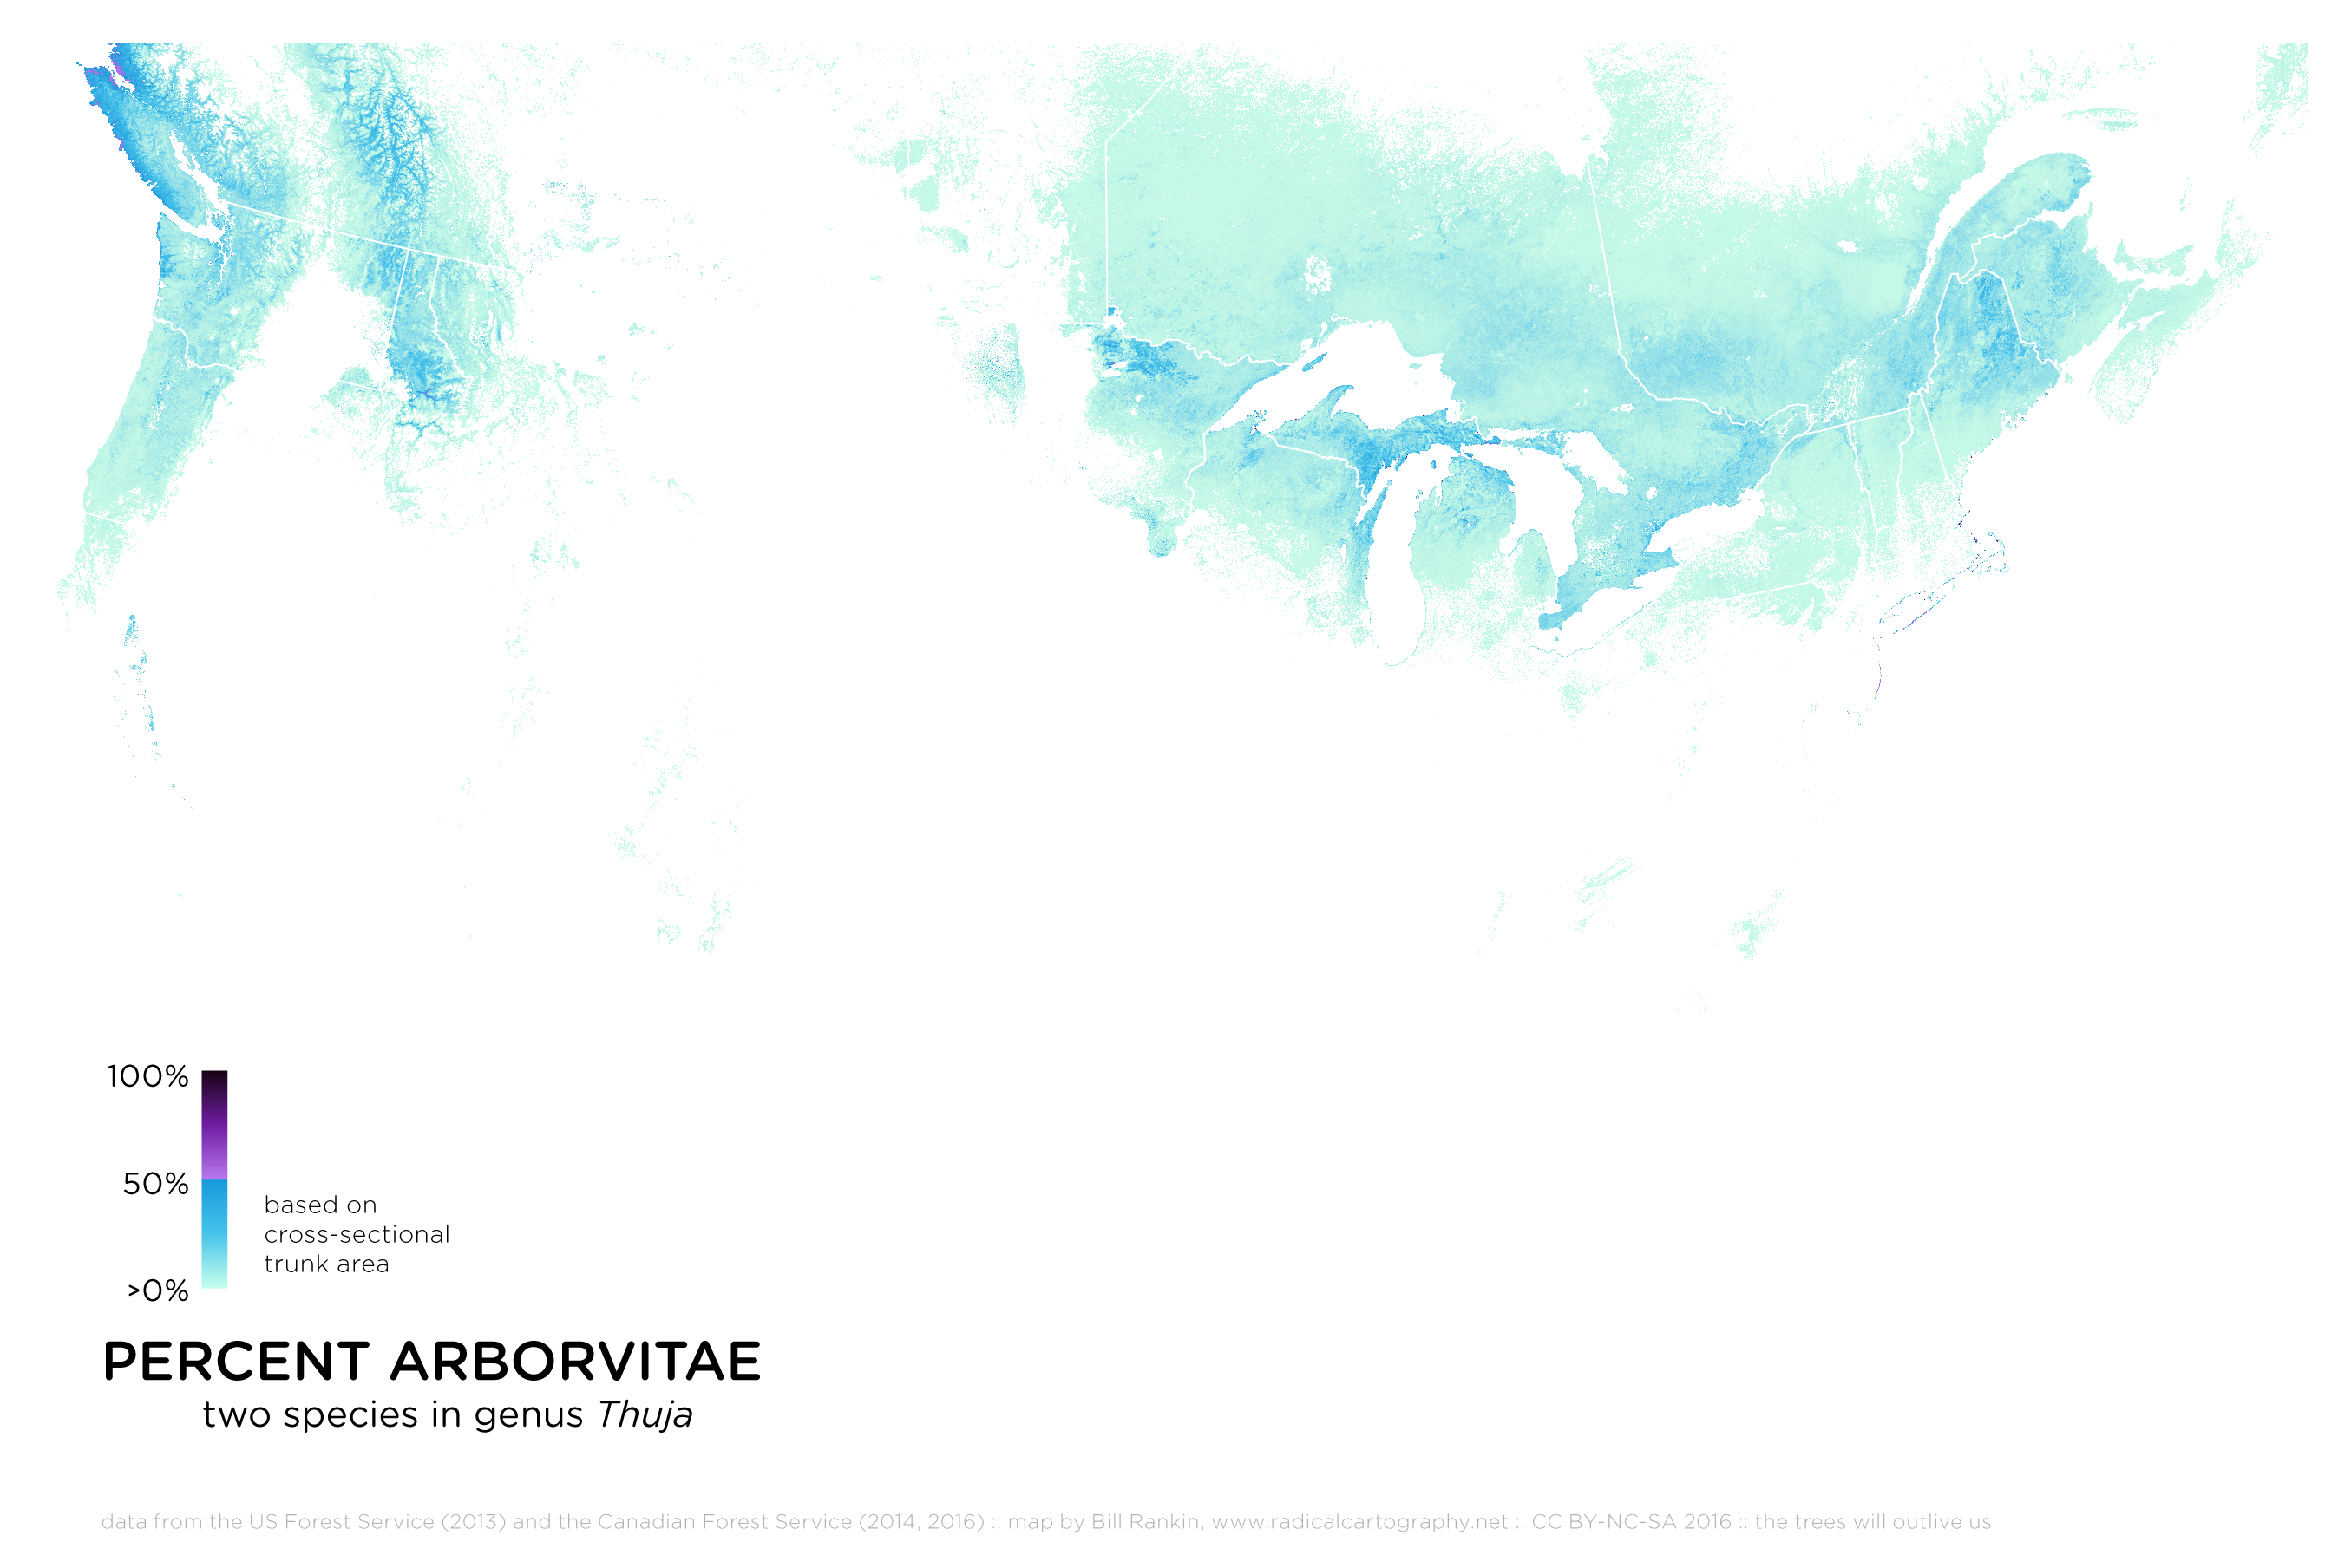
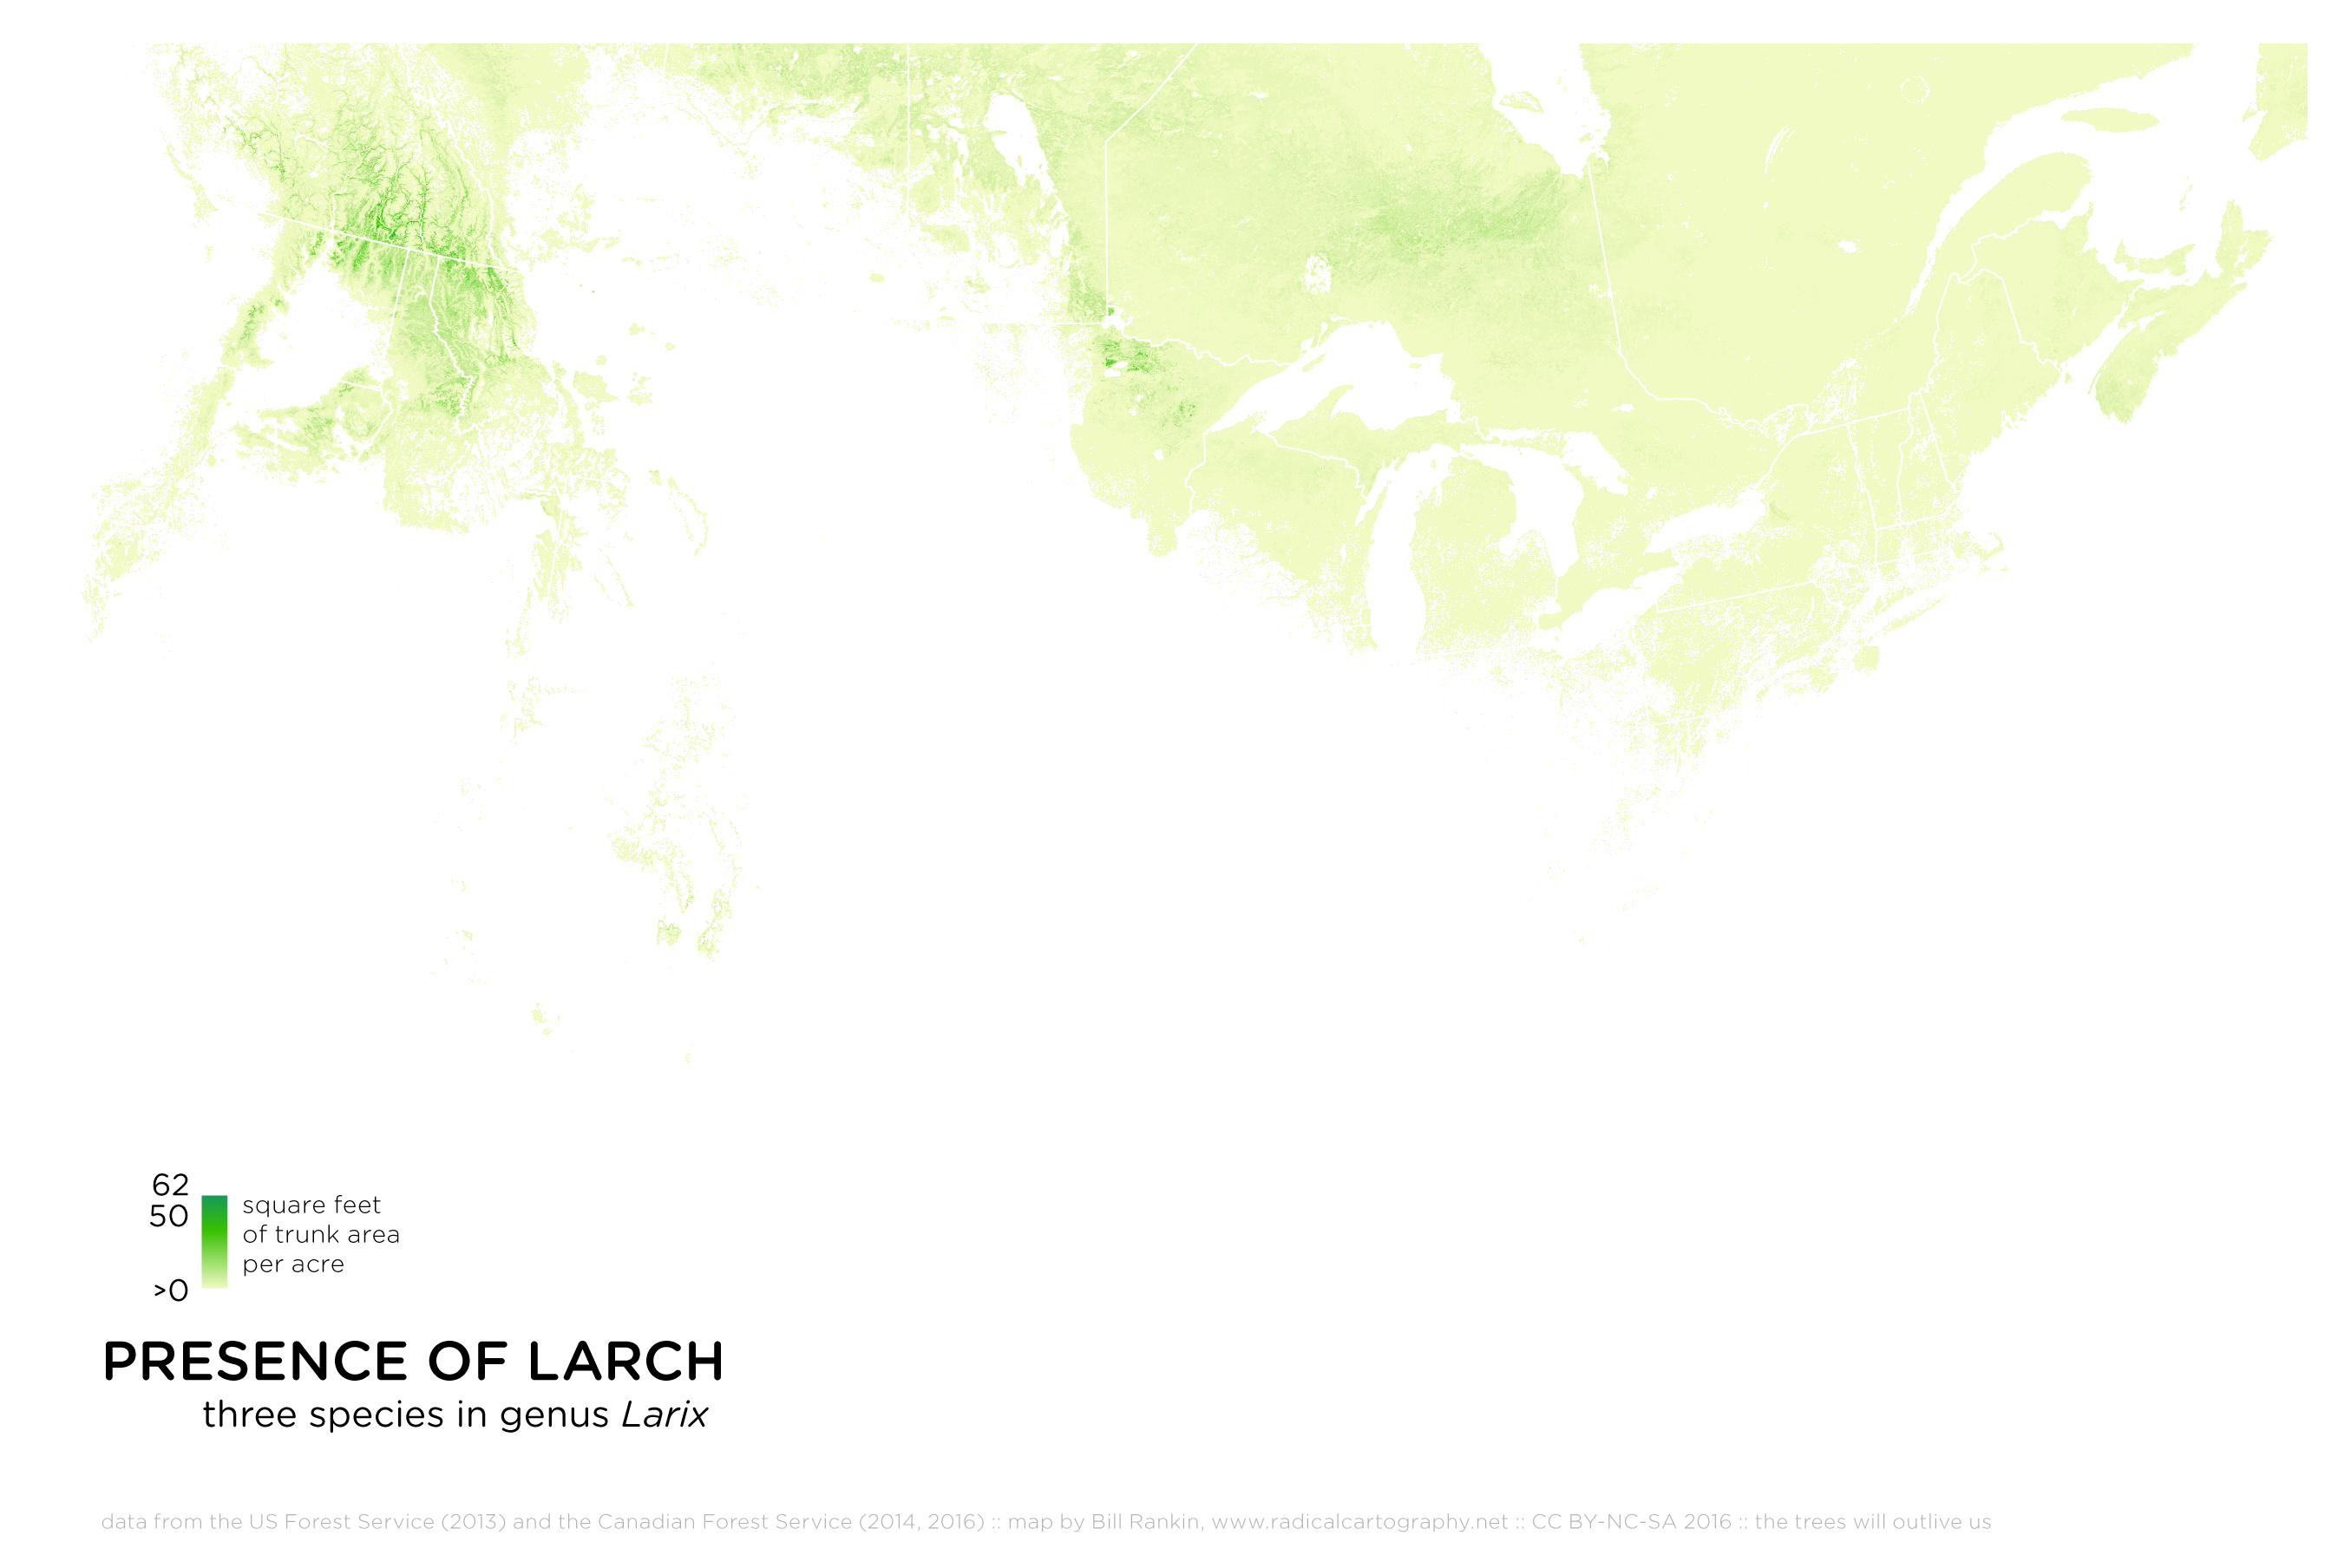
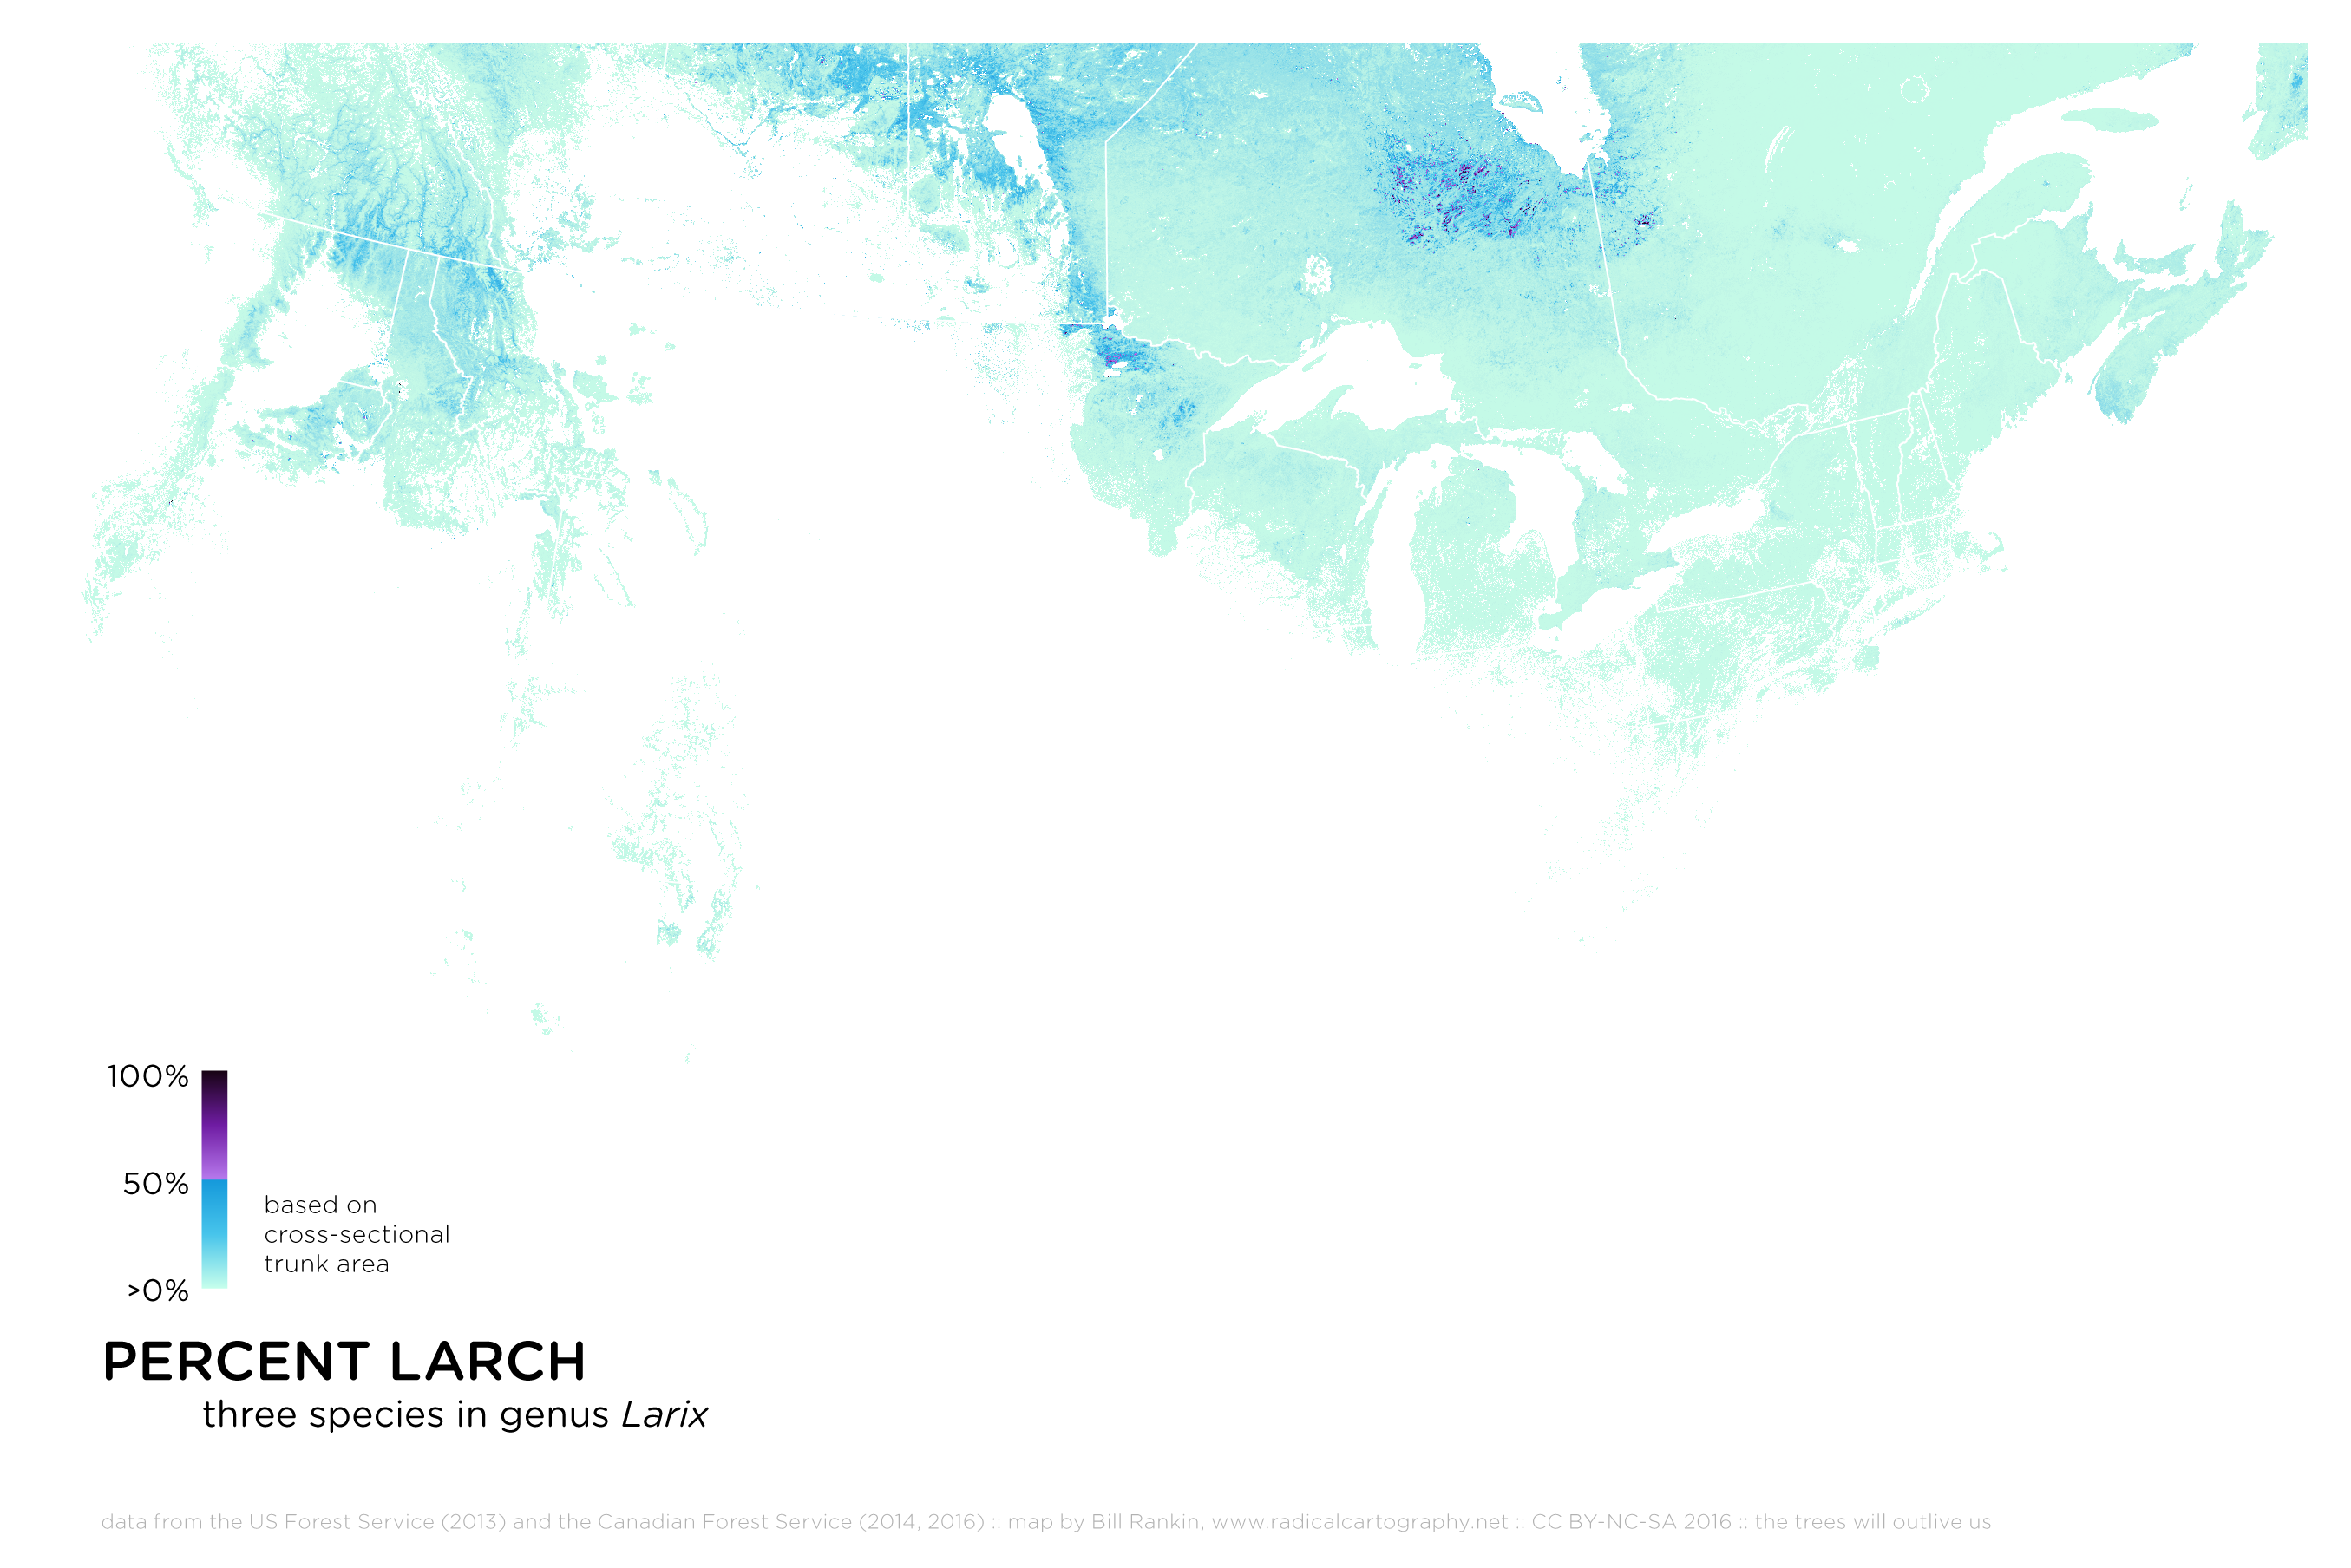
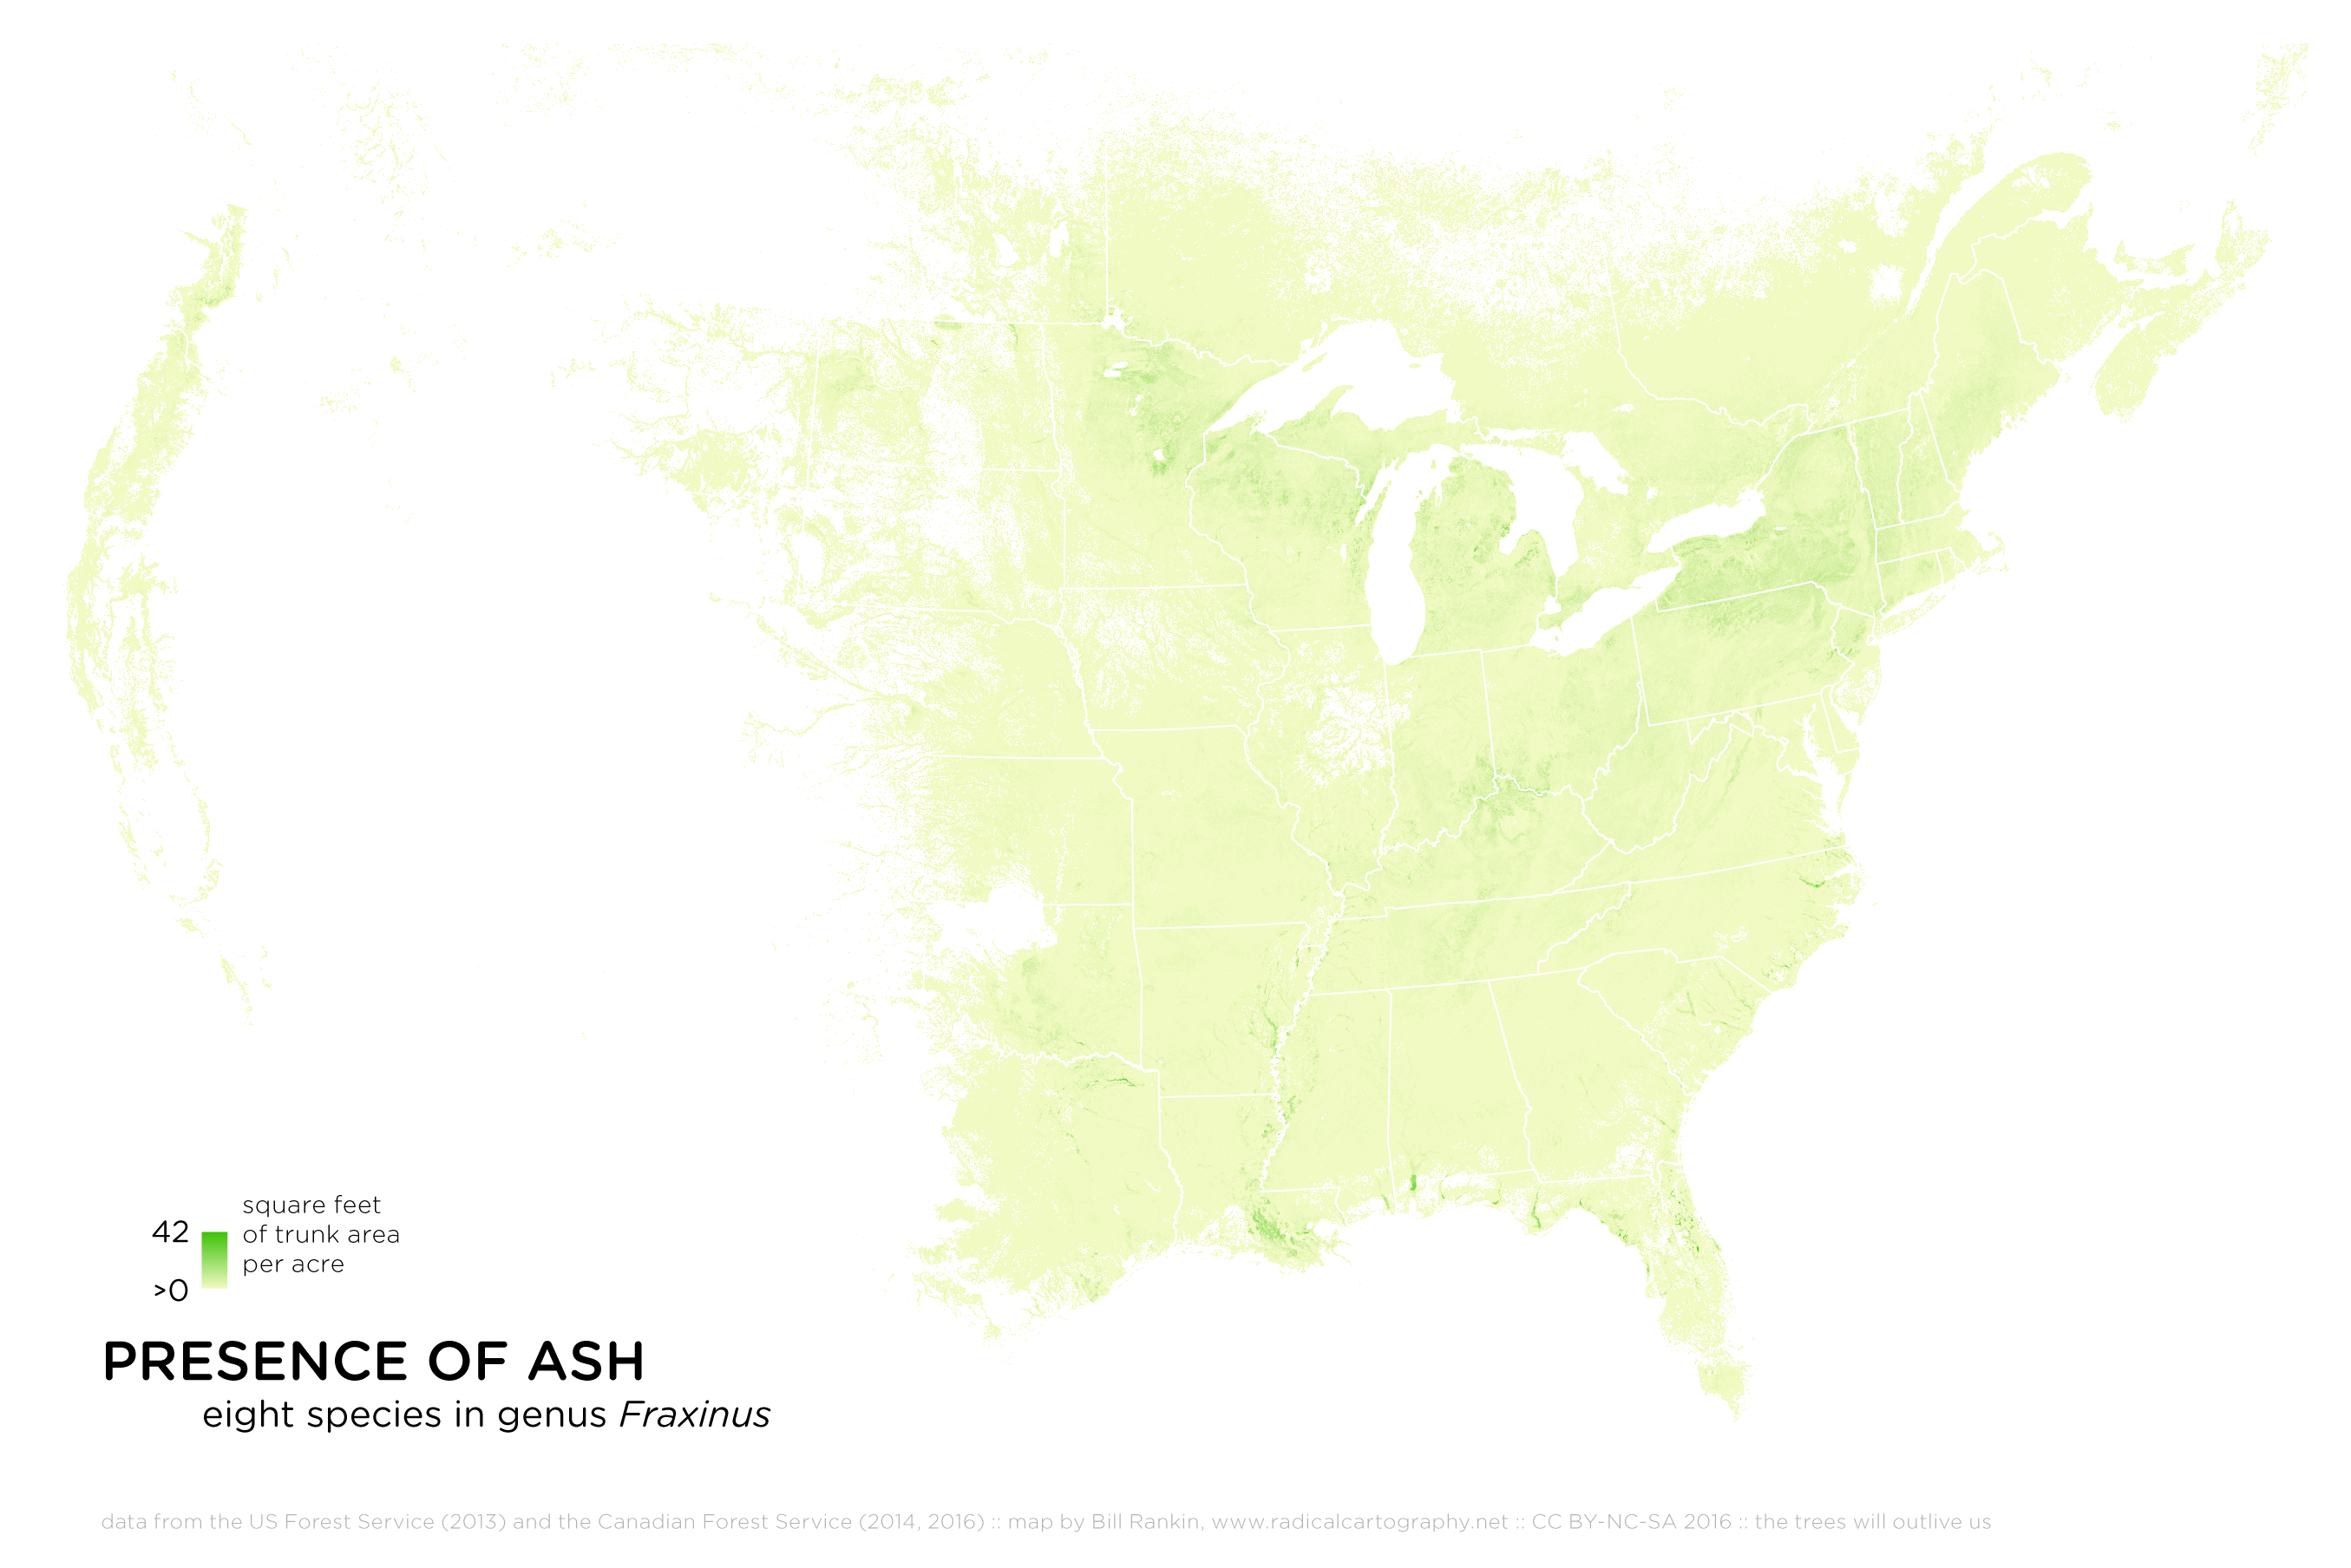
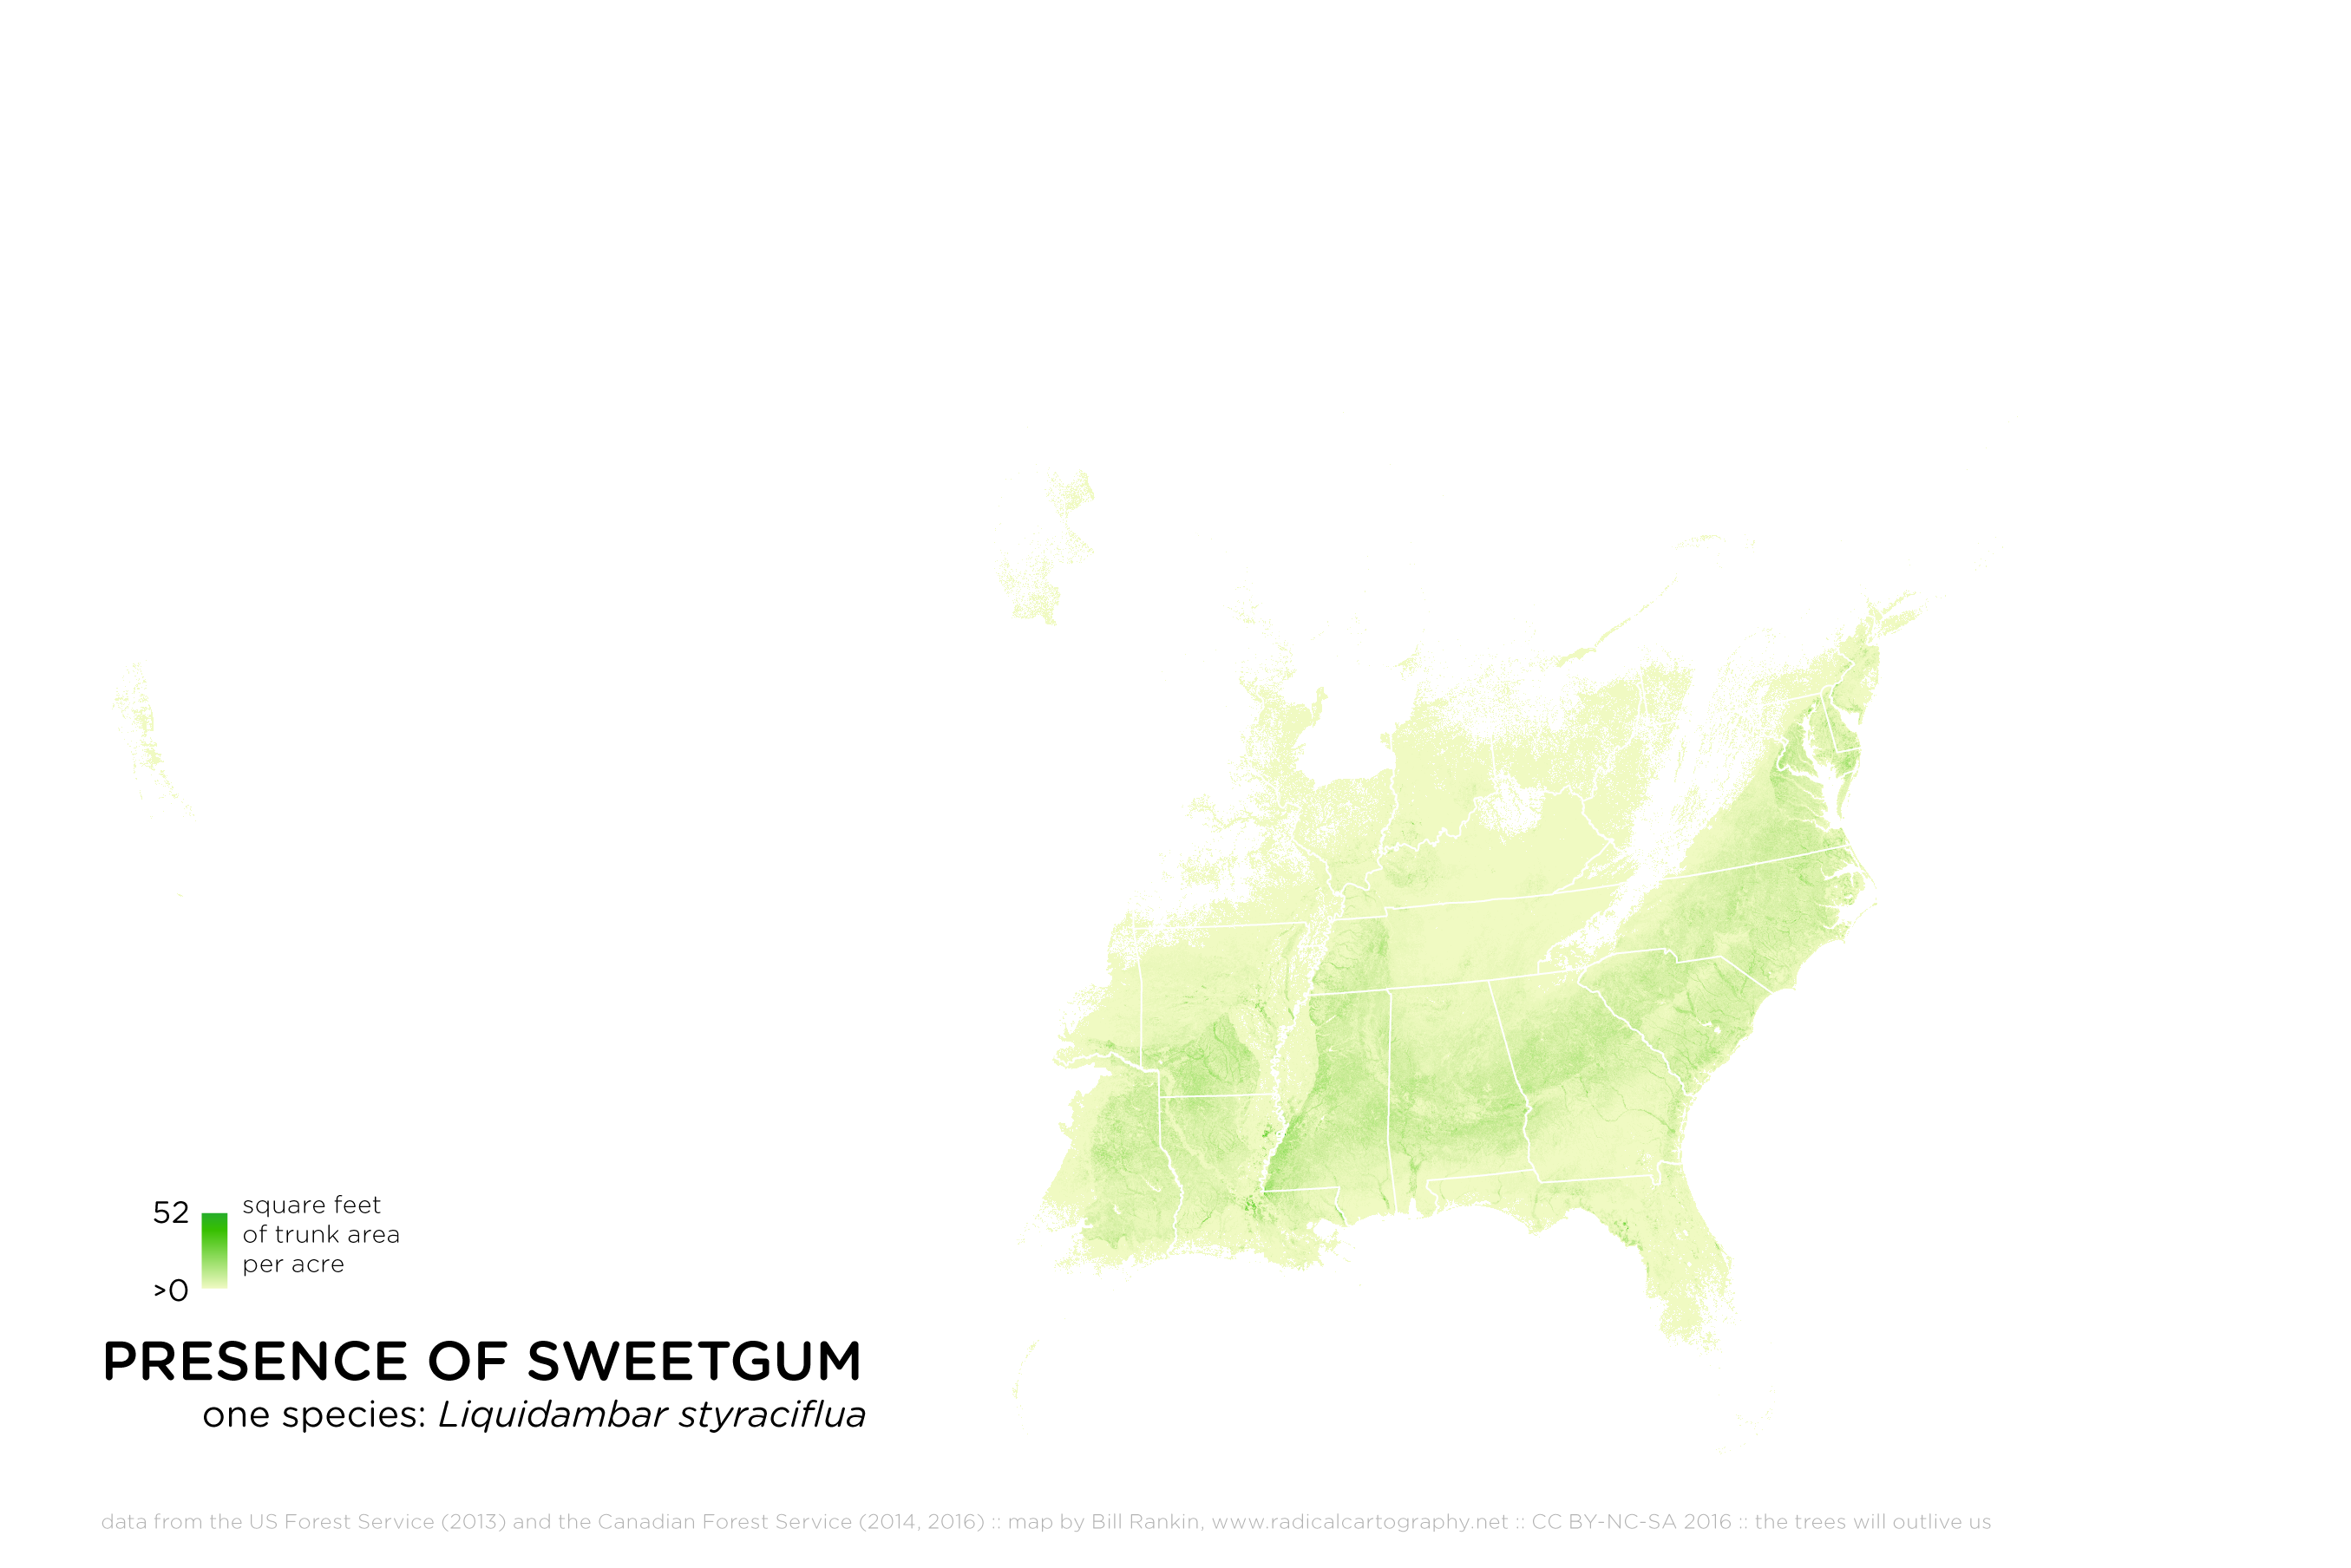
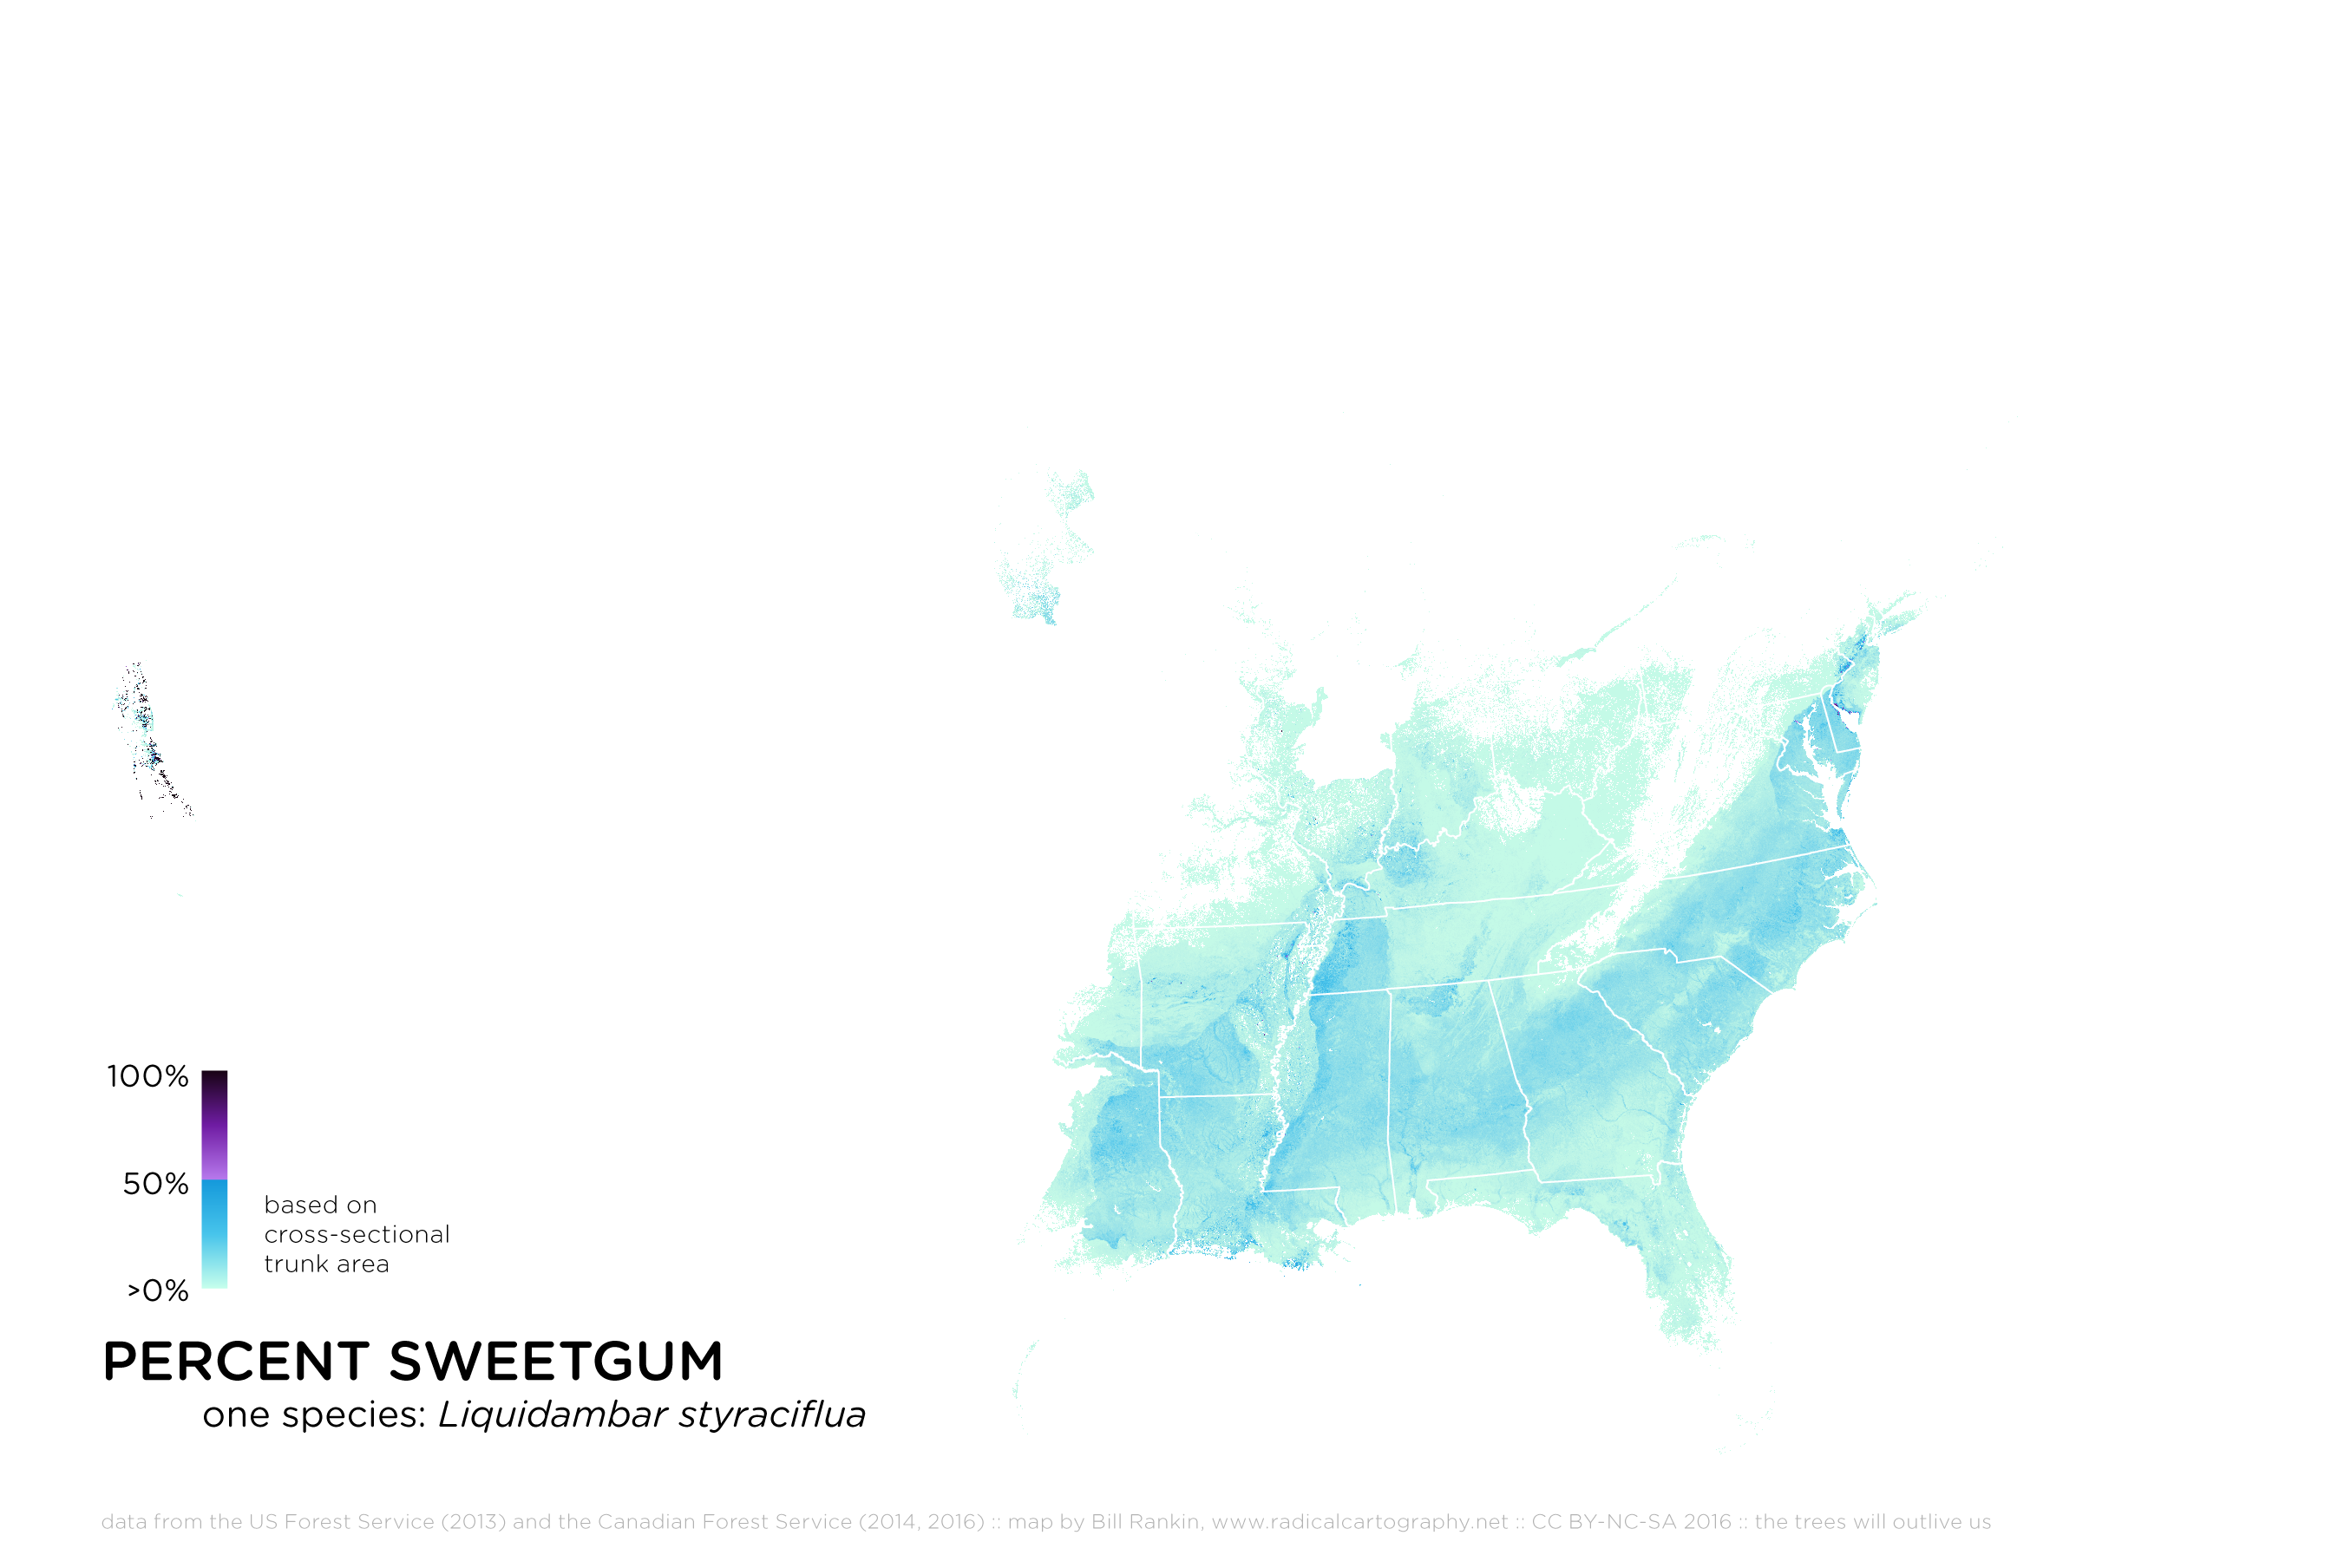
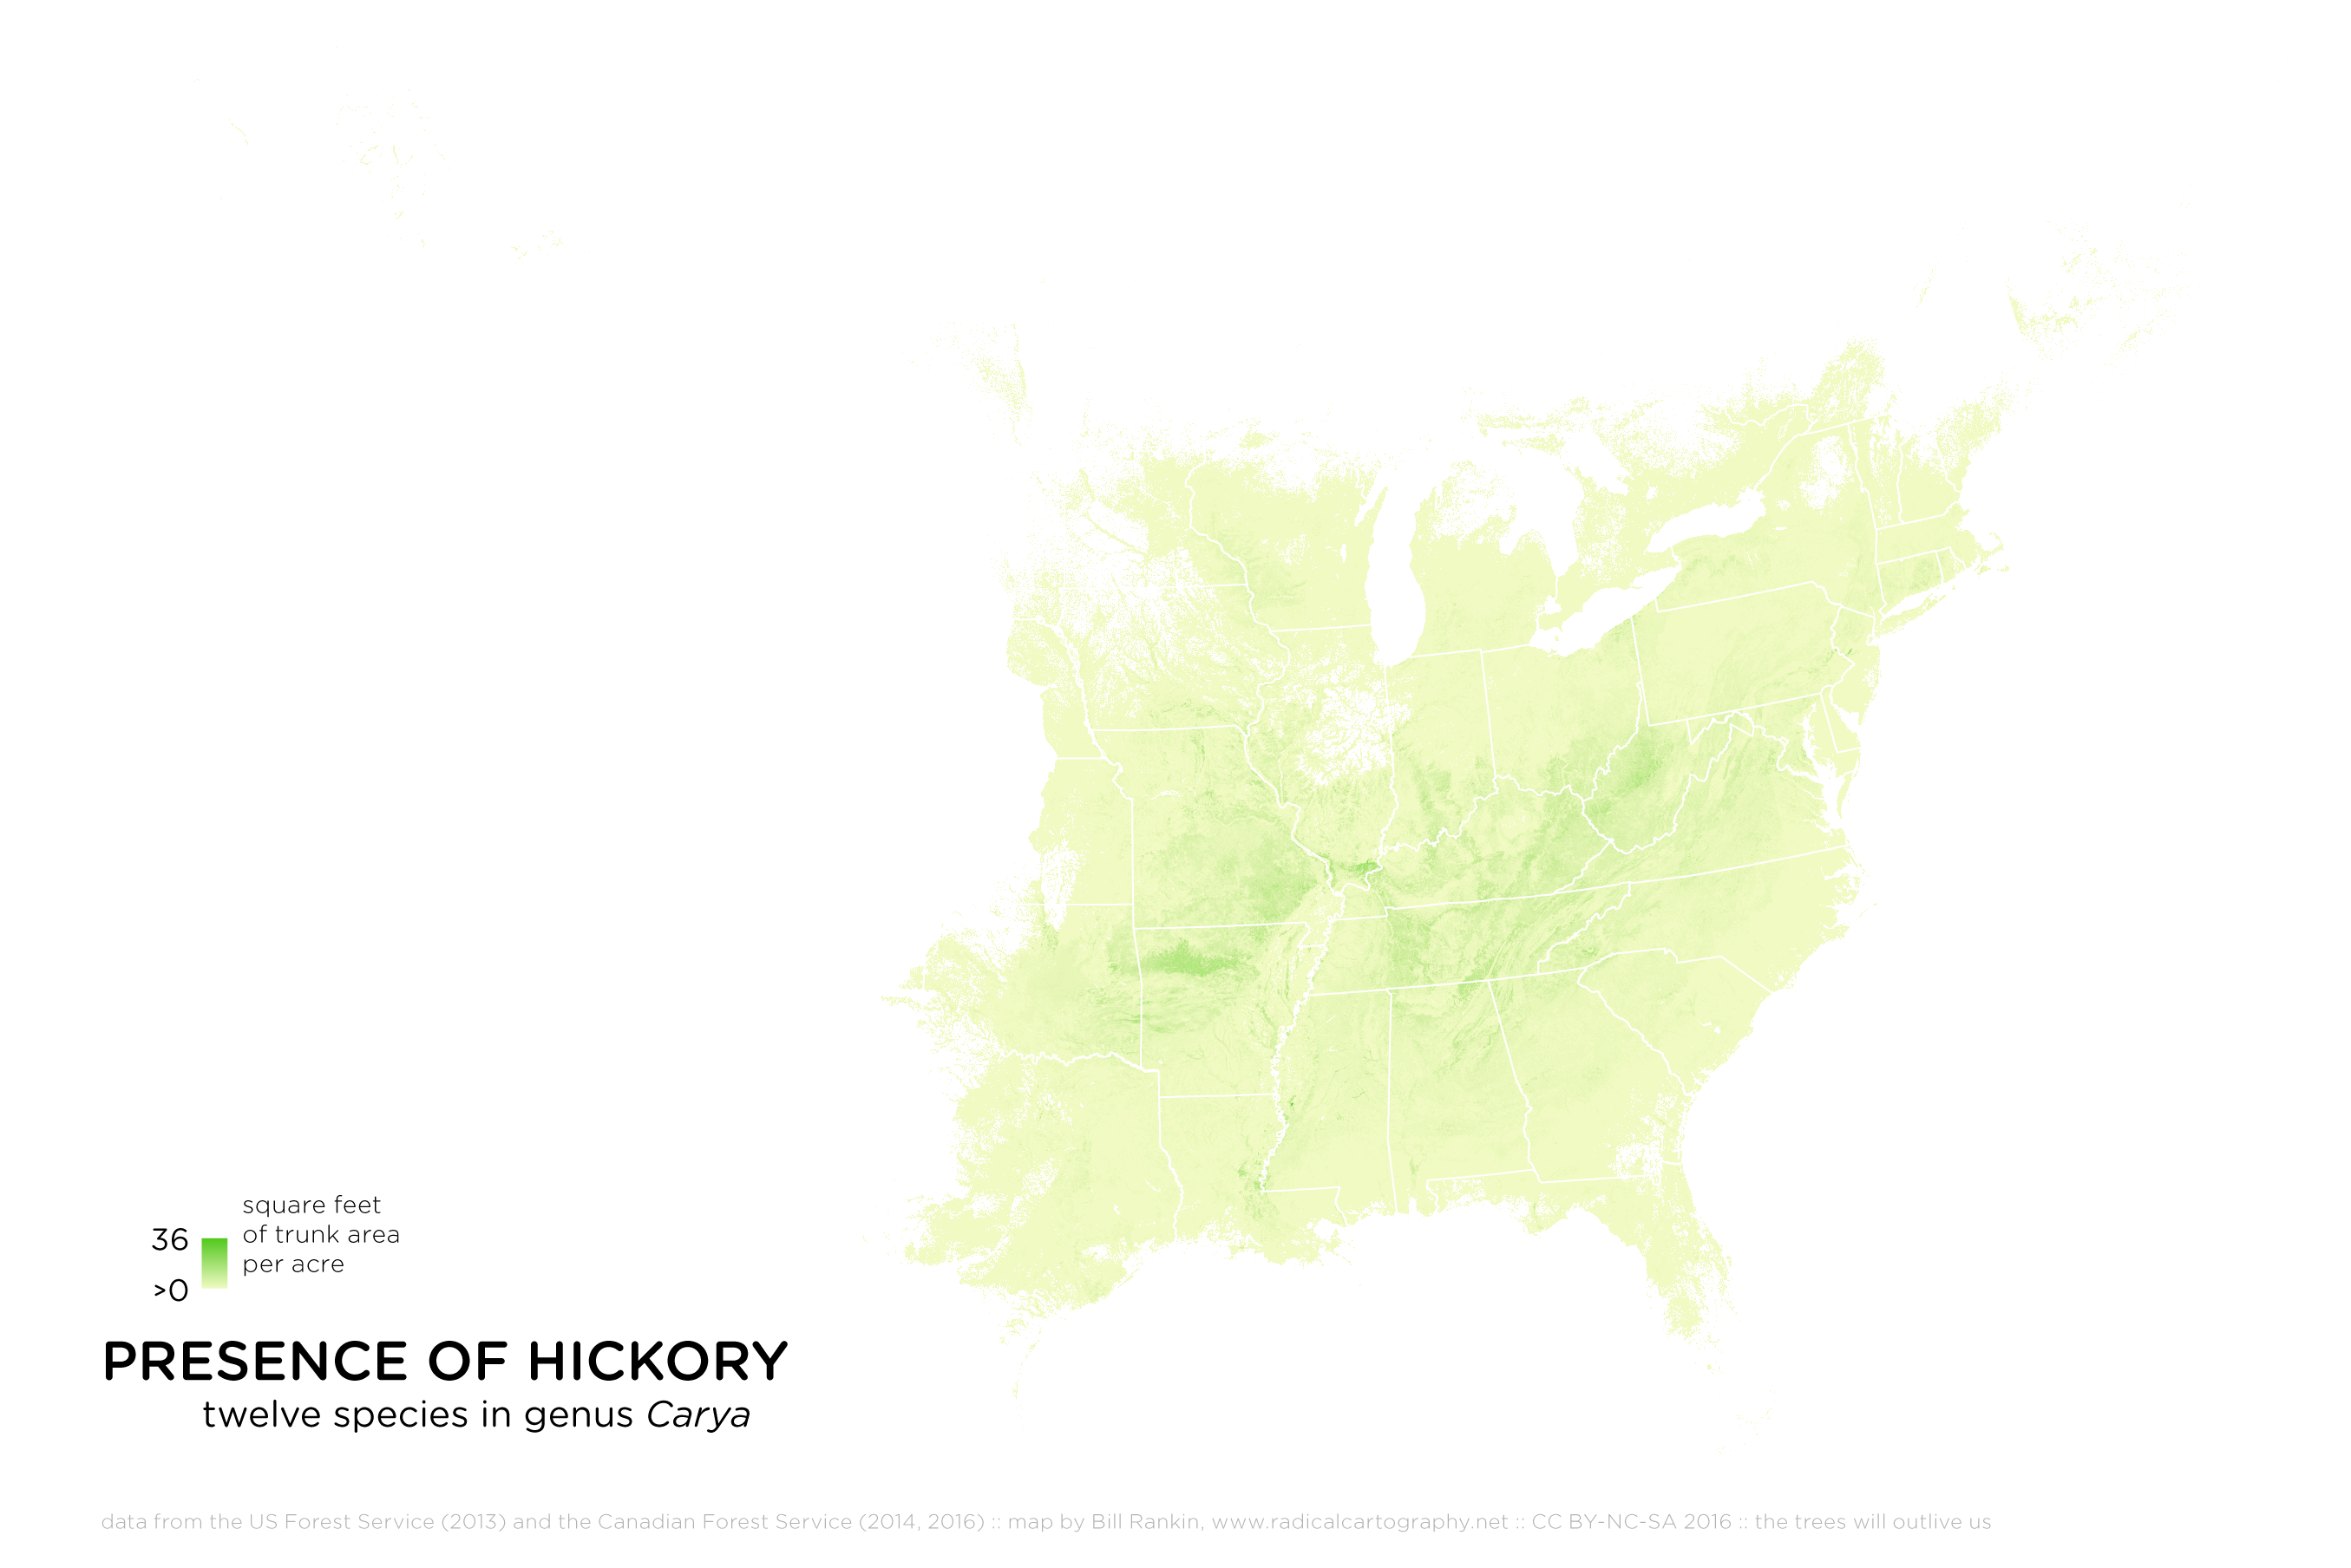
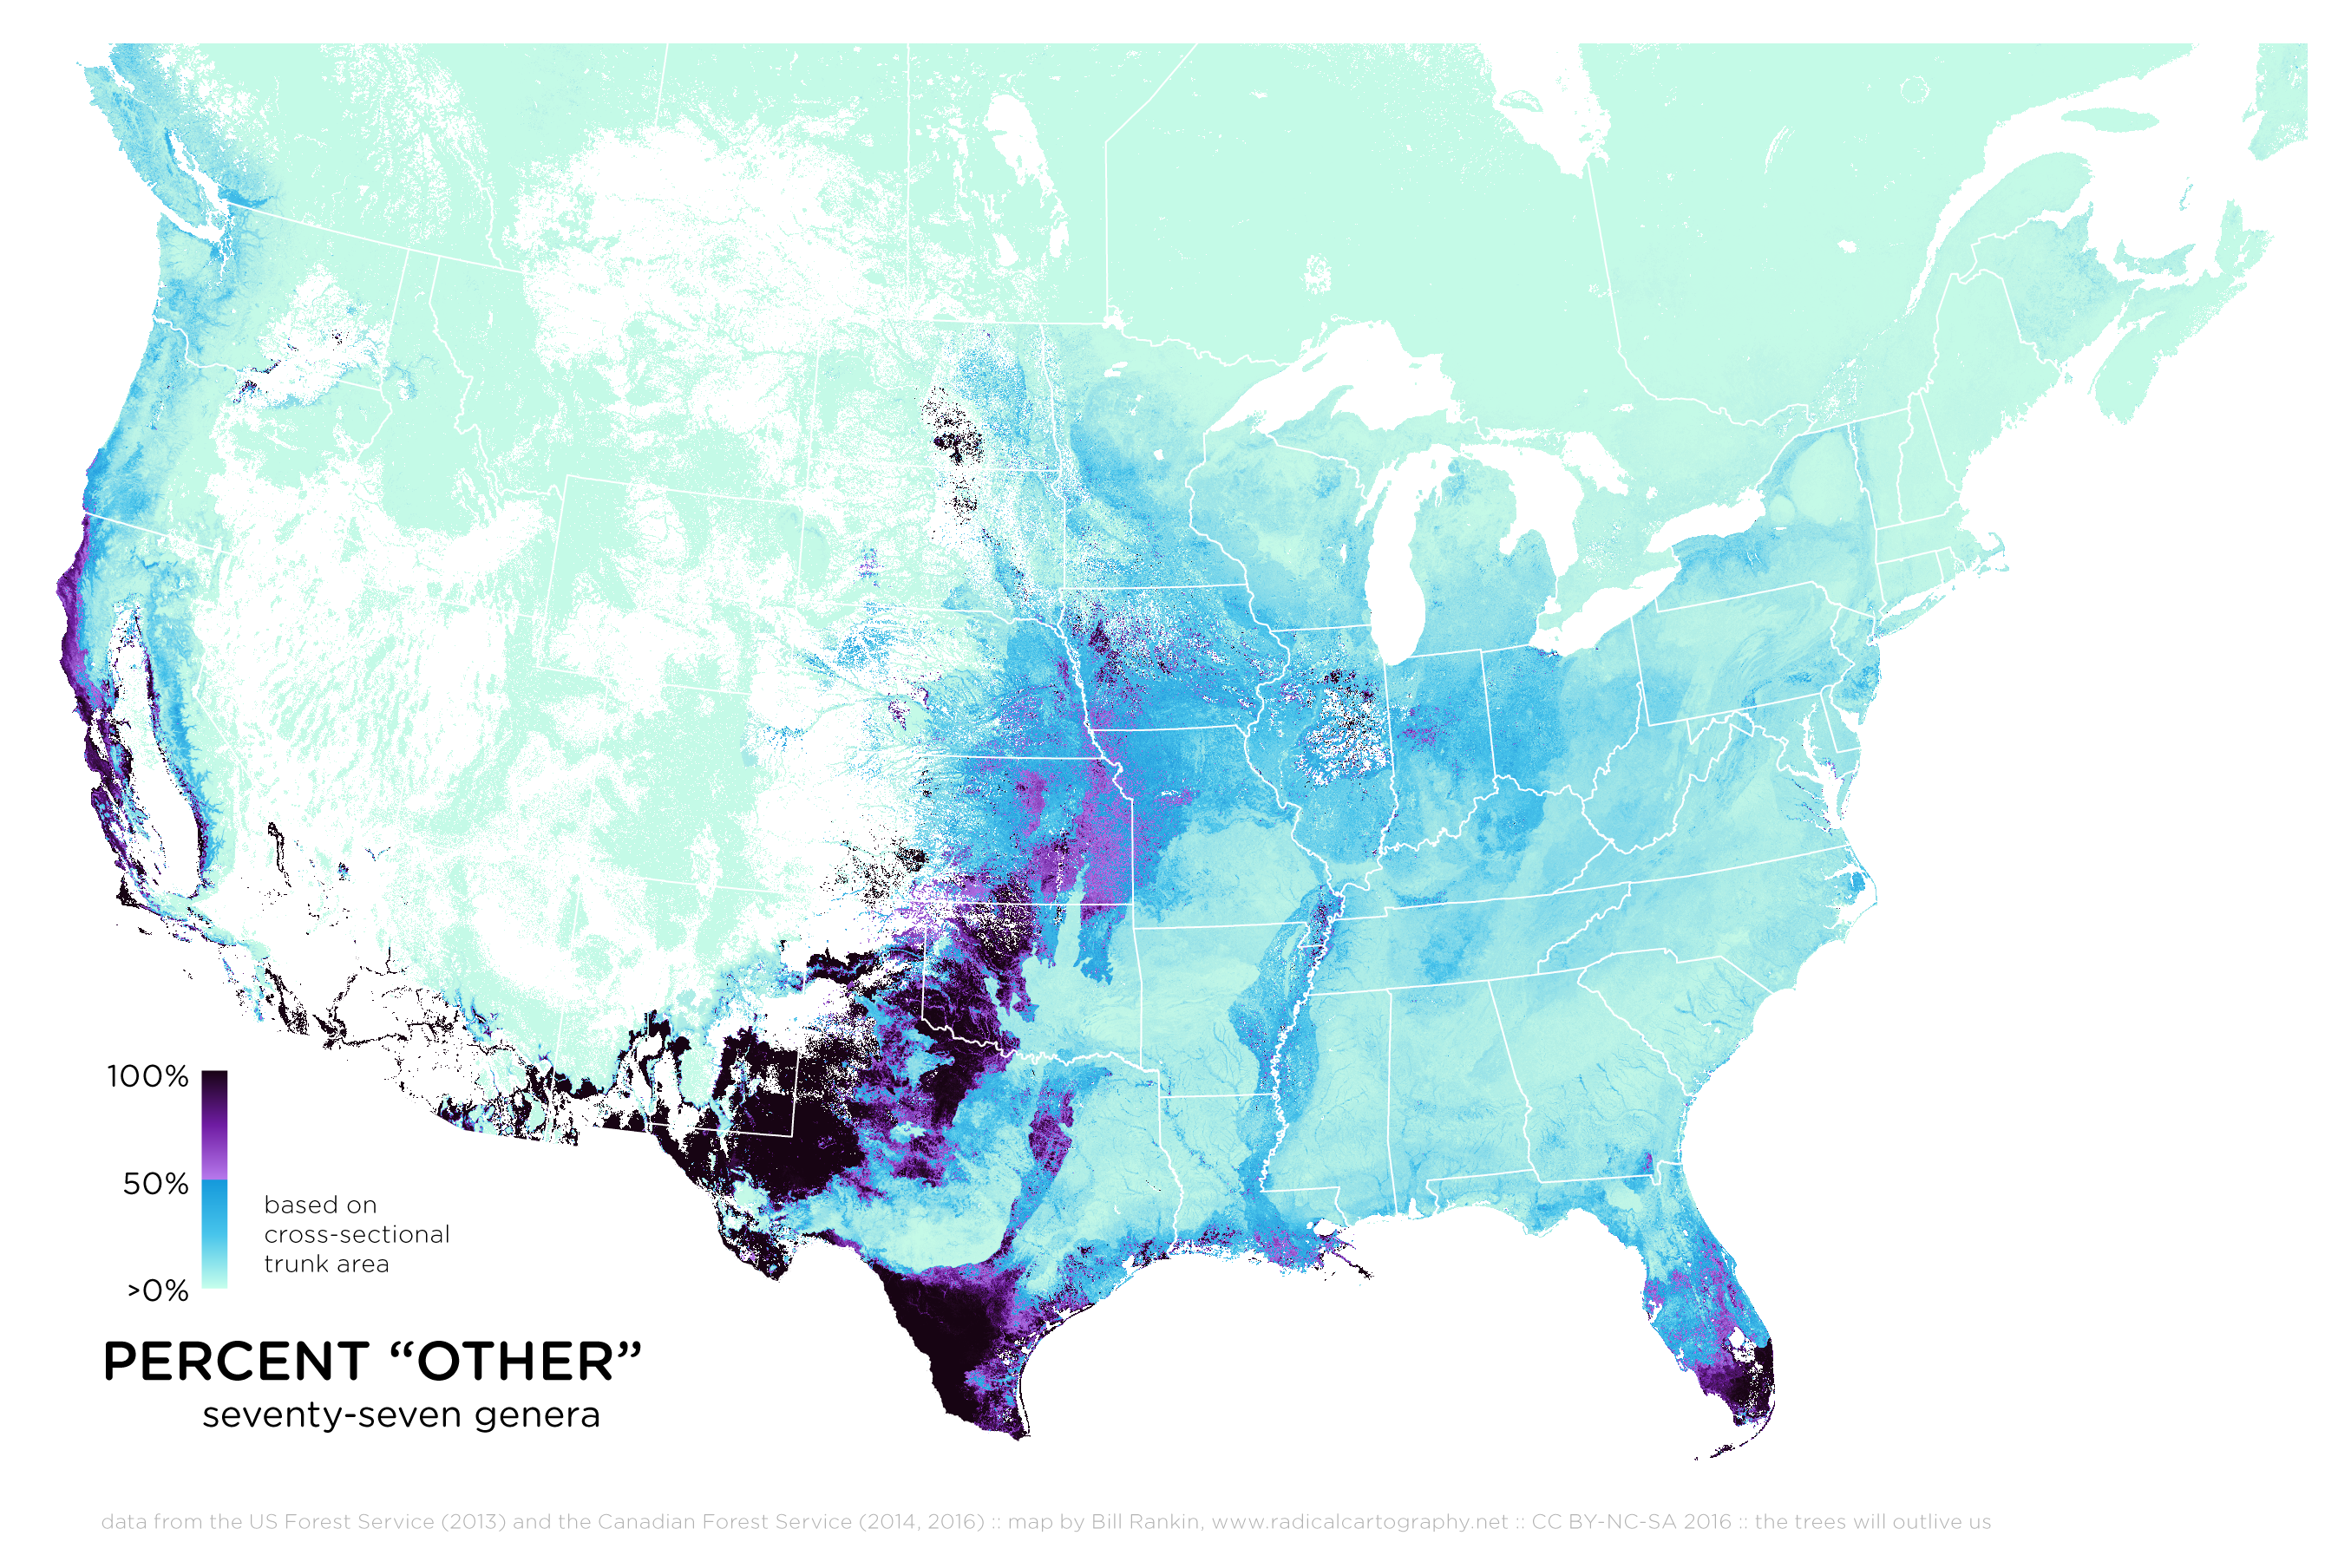
Nearly all tree-range maps share two characteristics: they show a single species at a time, and they show each species's range as a solid-colored blob — like this. But for most people, the species is less meaningful than the genus — pine rather than white pine, red pine, and so on — and trees are never uniformly distributed within their range.
It also turns out that nearly all existing tree-range maps were drawn in the 1960s and 1970s by one person — Elbert Little, Jr. — to show the "original" range, before European settlement. (Osage orange is the classic example of how misleading these maps can be.)
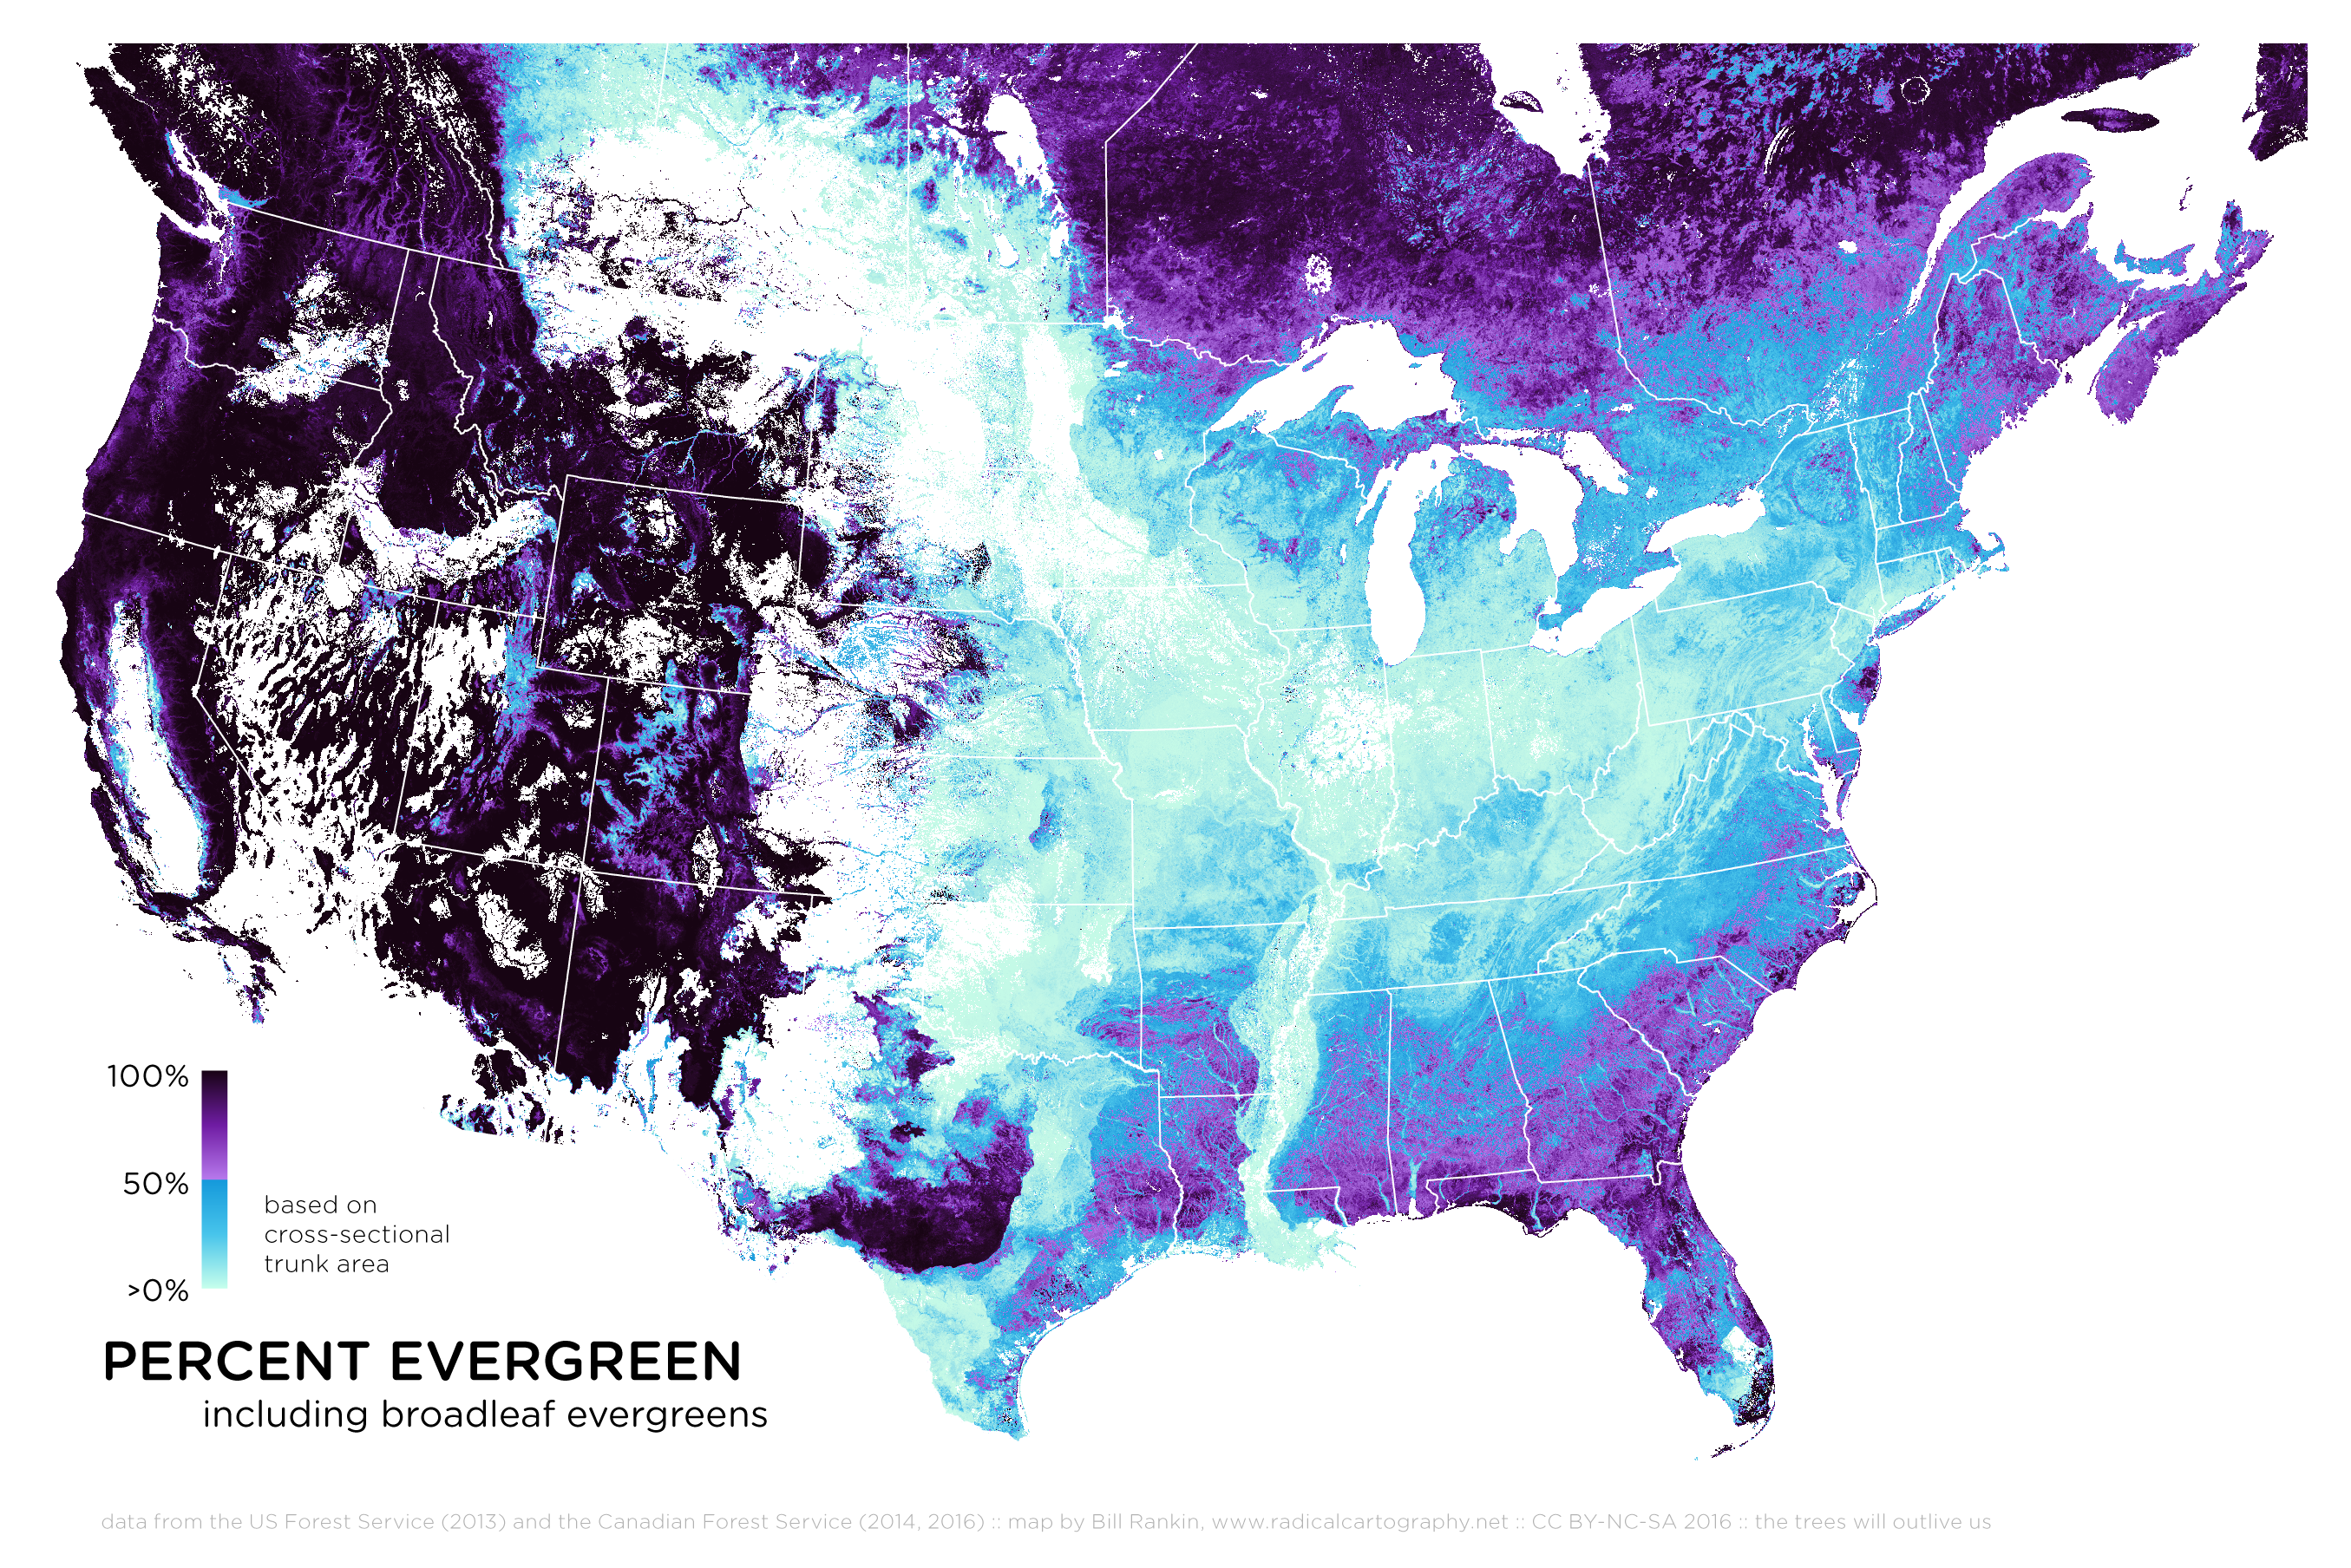
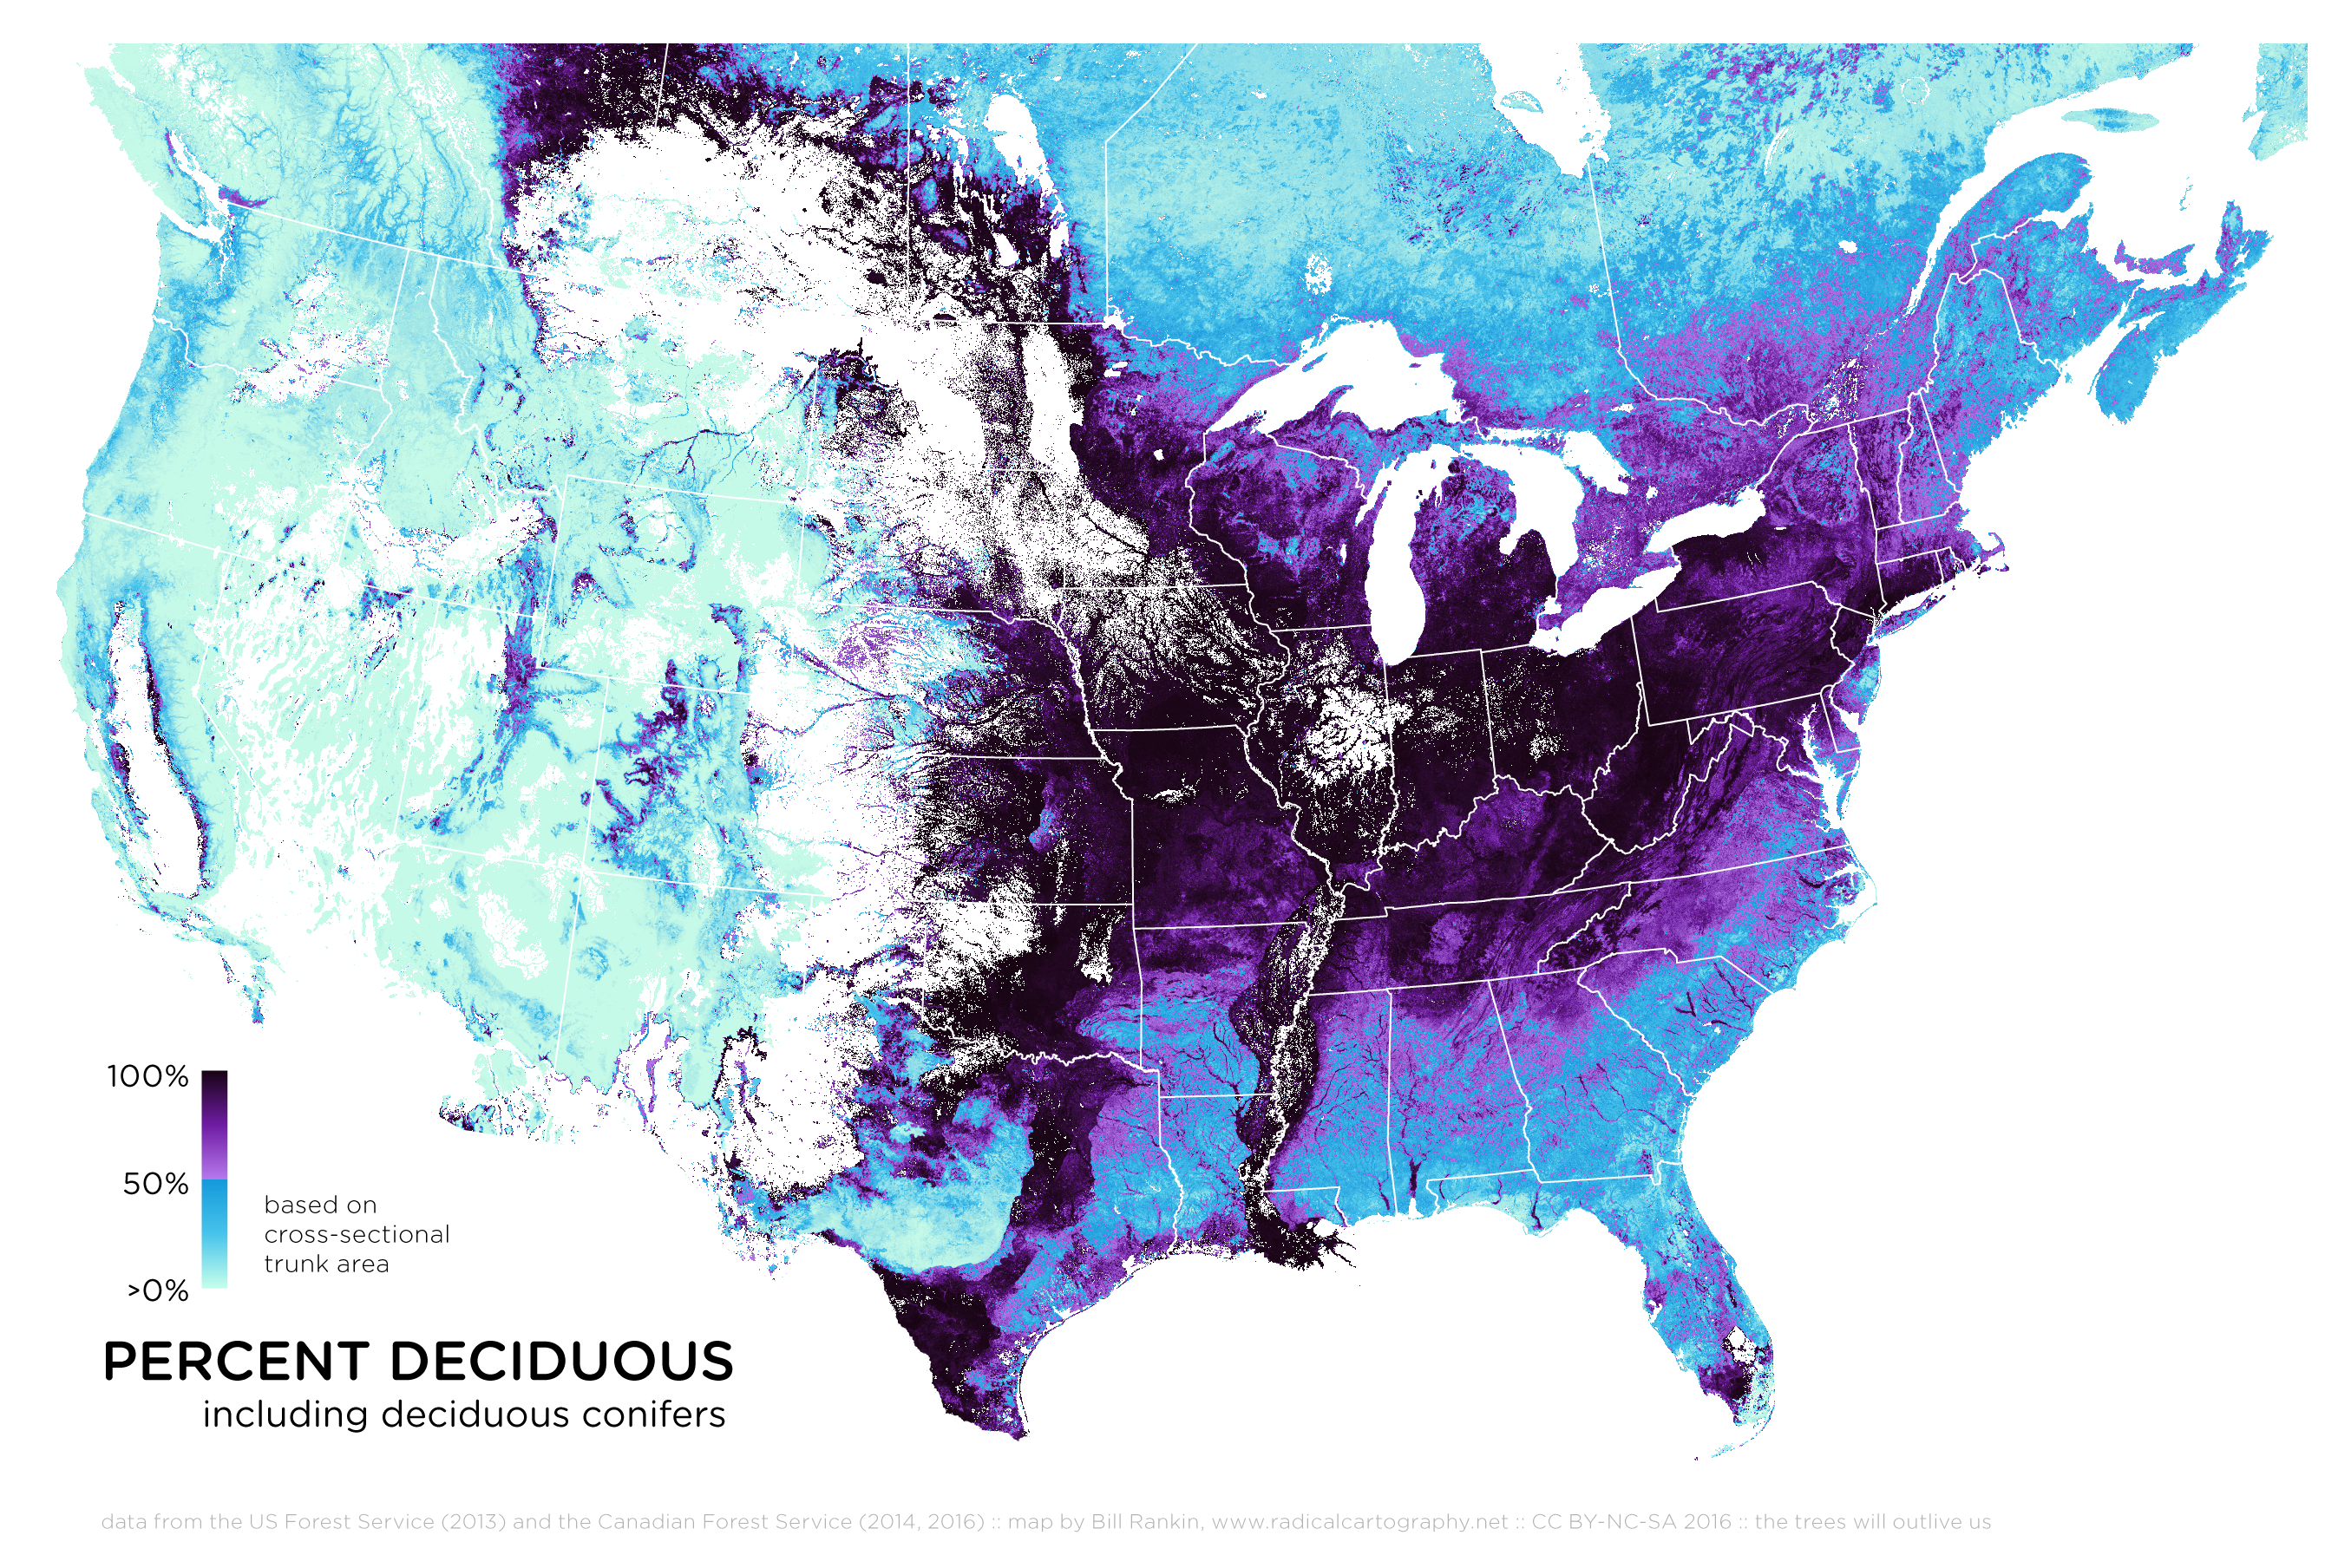
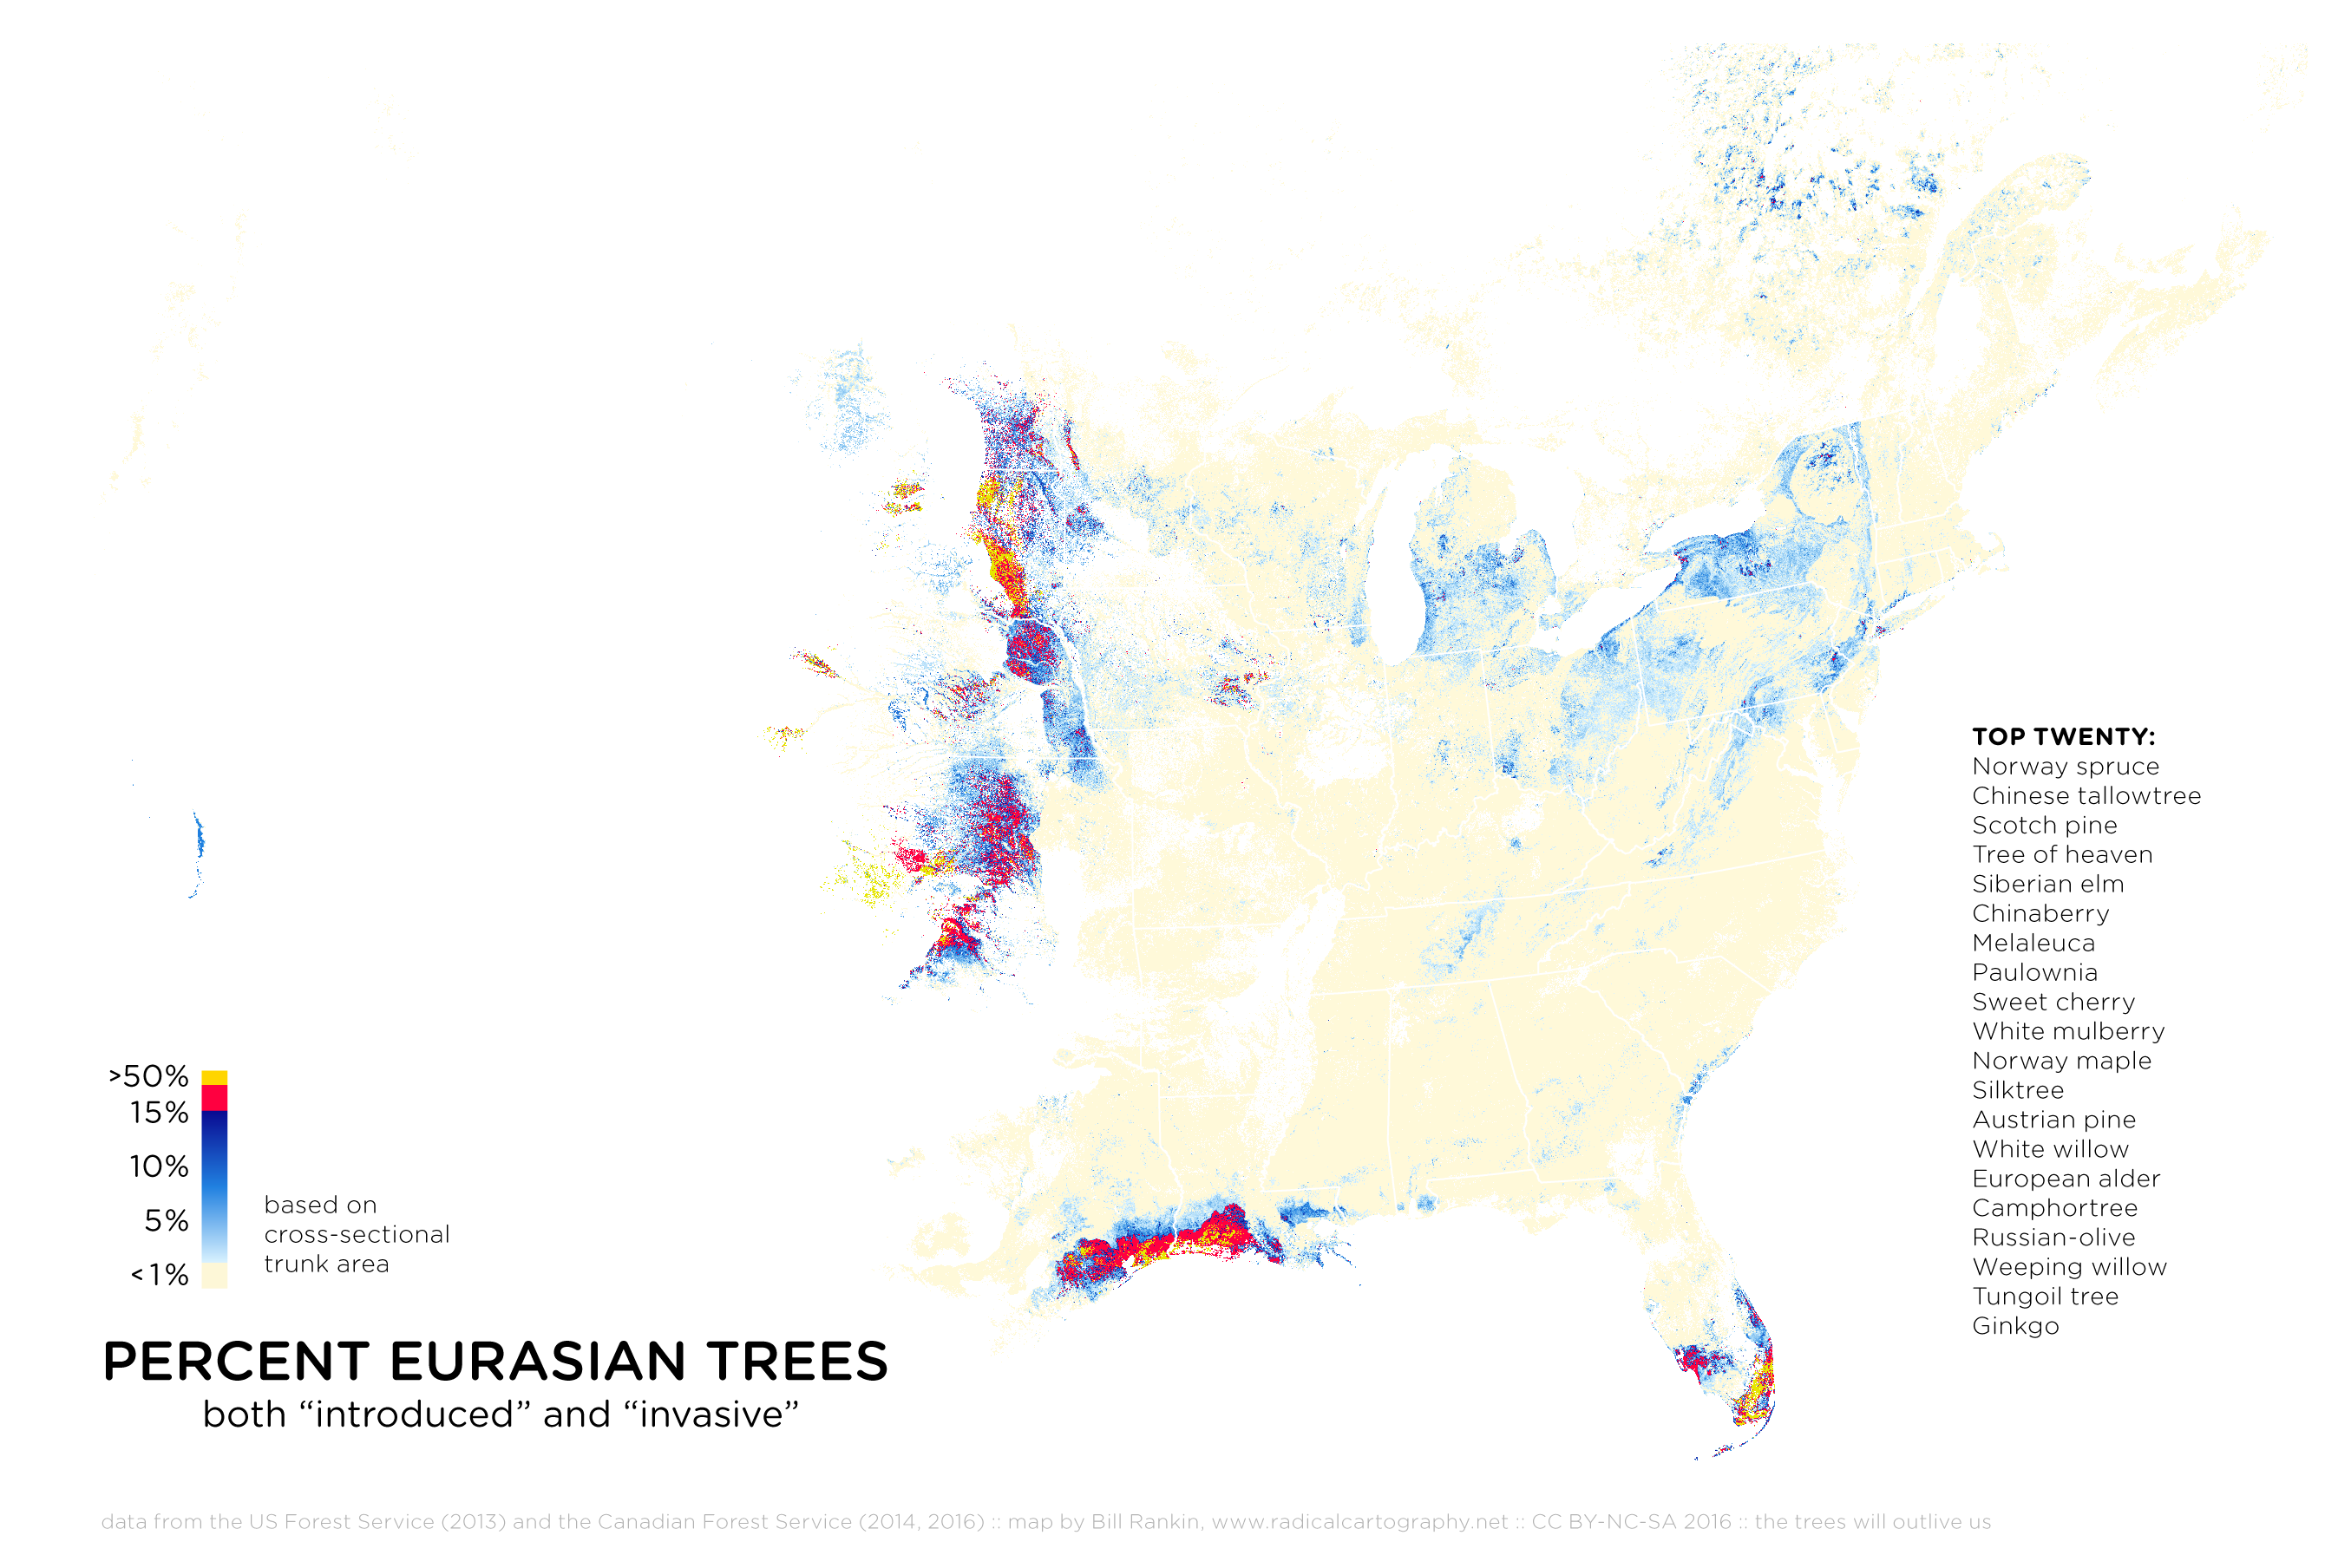
My maps show patterns that can't be seen with the usual blob maps. In addition to the absolute and relative distribution of the twenty most dominant tree types, I'm also showing higher-level patterns: species diversity, deciduosity, and non-American trees. The usual split between eastern and western forests is immediately apparent, but so is the less well-known wedge of deciduous trees, which stretches from the Great Plains savanna and Mississippi alluvial plain to the forests of southern New England.
I've also used this same data to find more personally meaningful regions as well.
Data based on kNN modeling from the US Forest Service (2013) and the Canadian Forest Service (2014, 2016). Discontinuities are due to differences in metrics, modeling, and species selection. No comparable data available for Mexico.